State by state differences in per capita NEH funding, 1967 - 2020
Benjamin Skinner
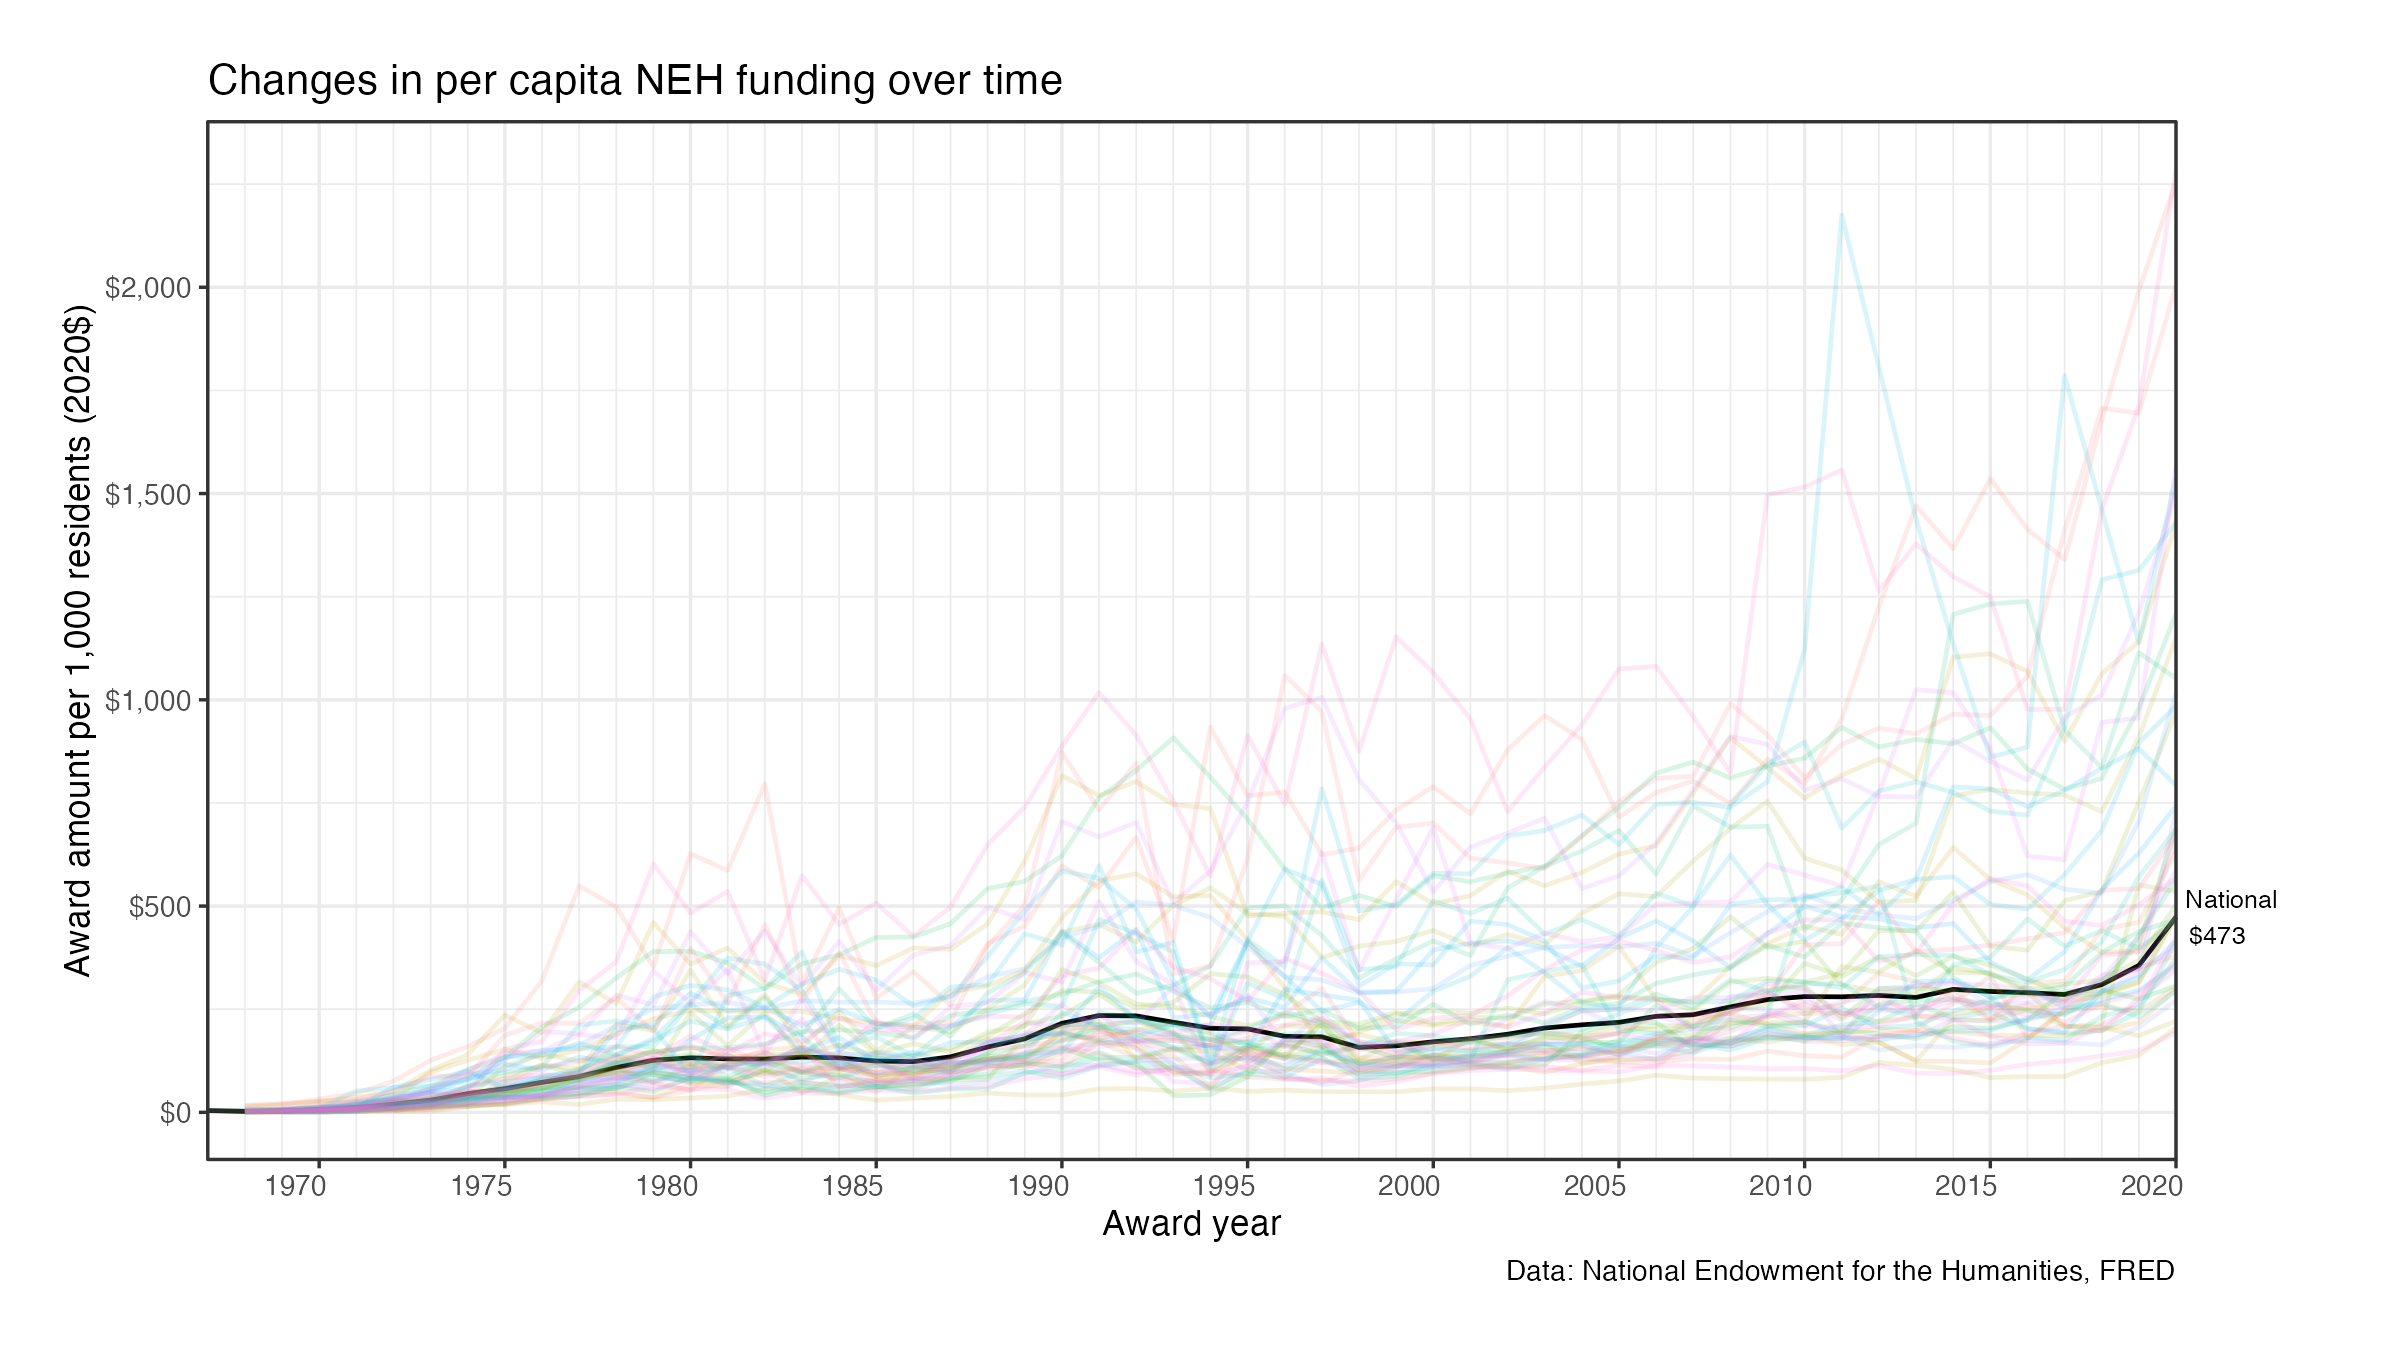
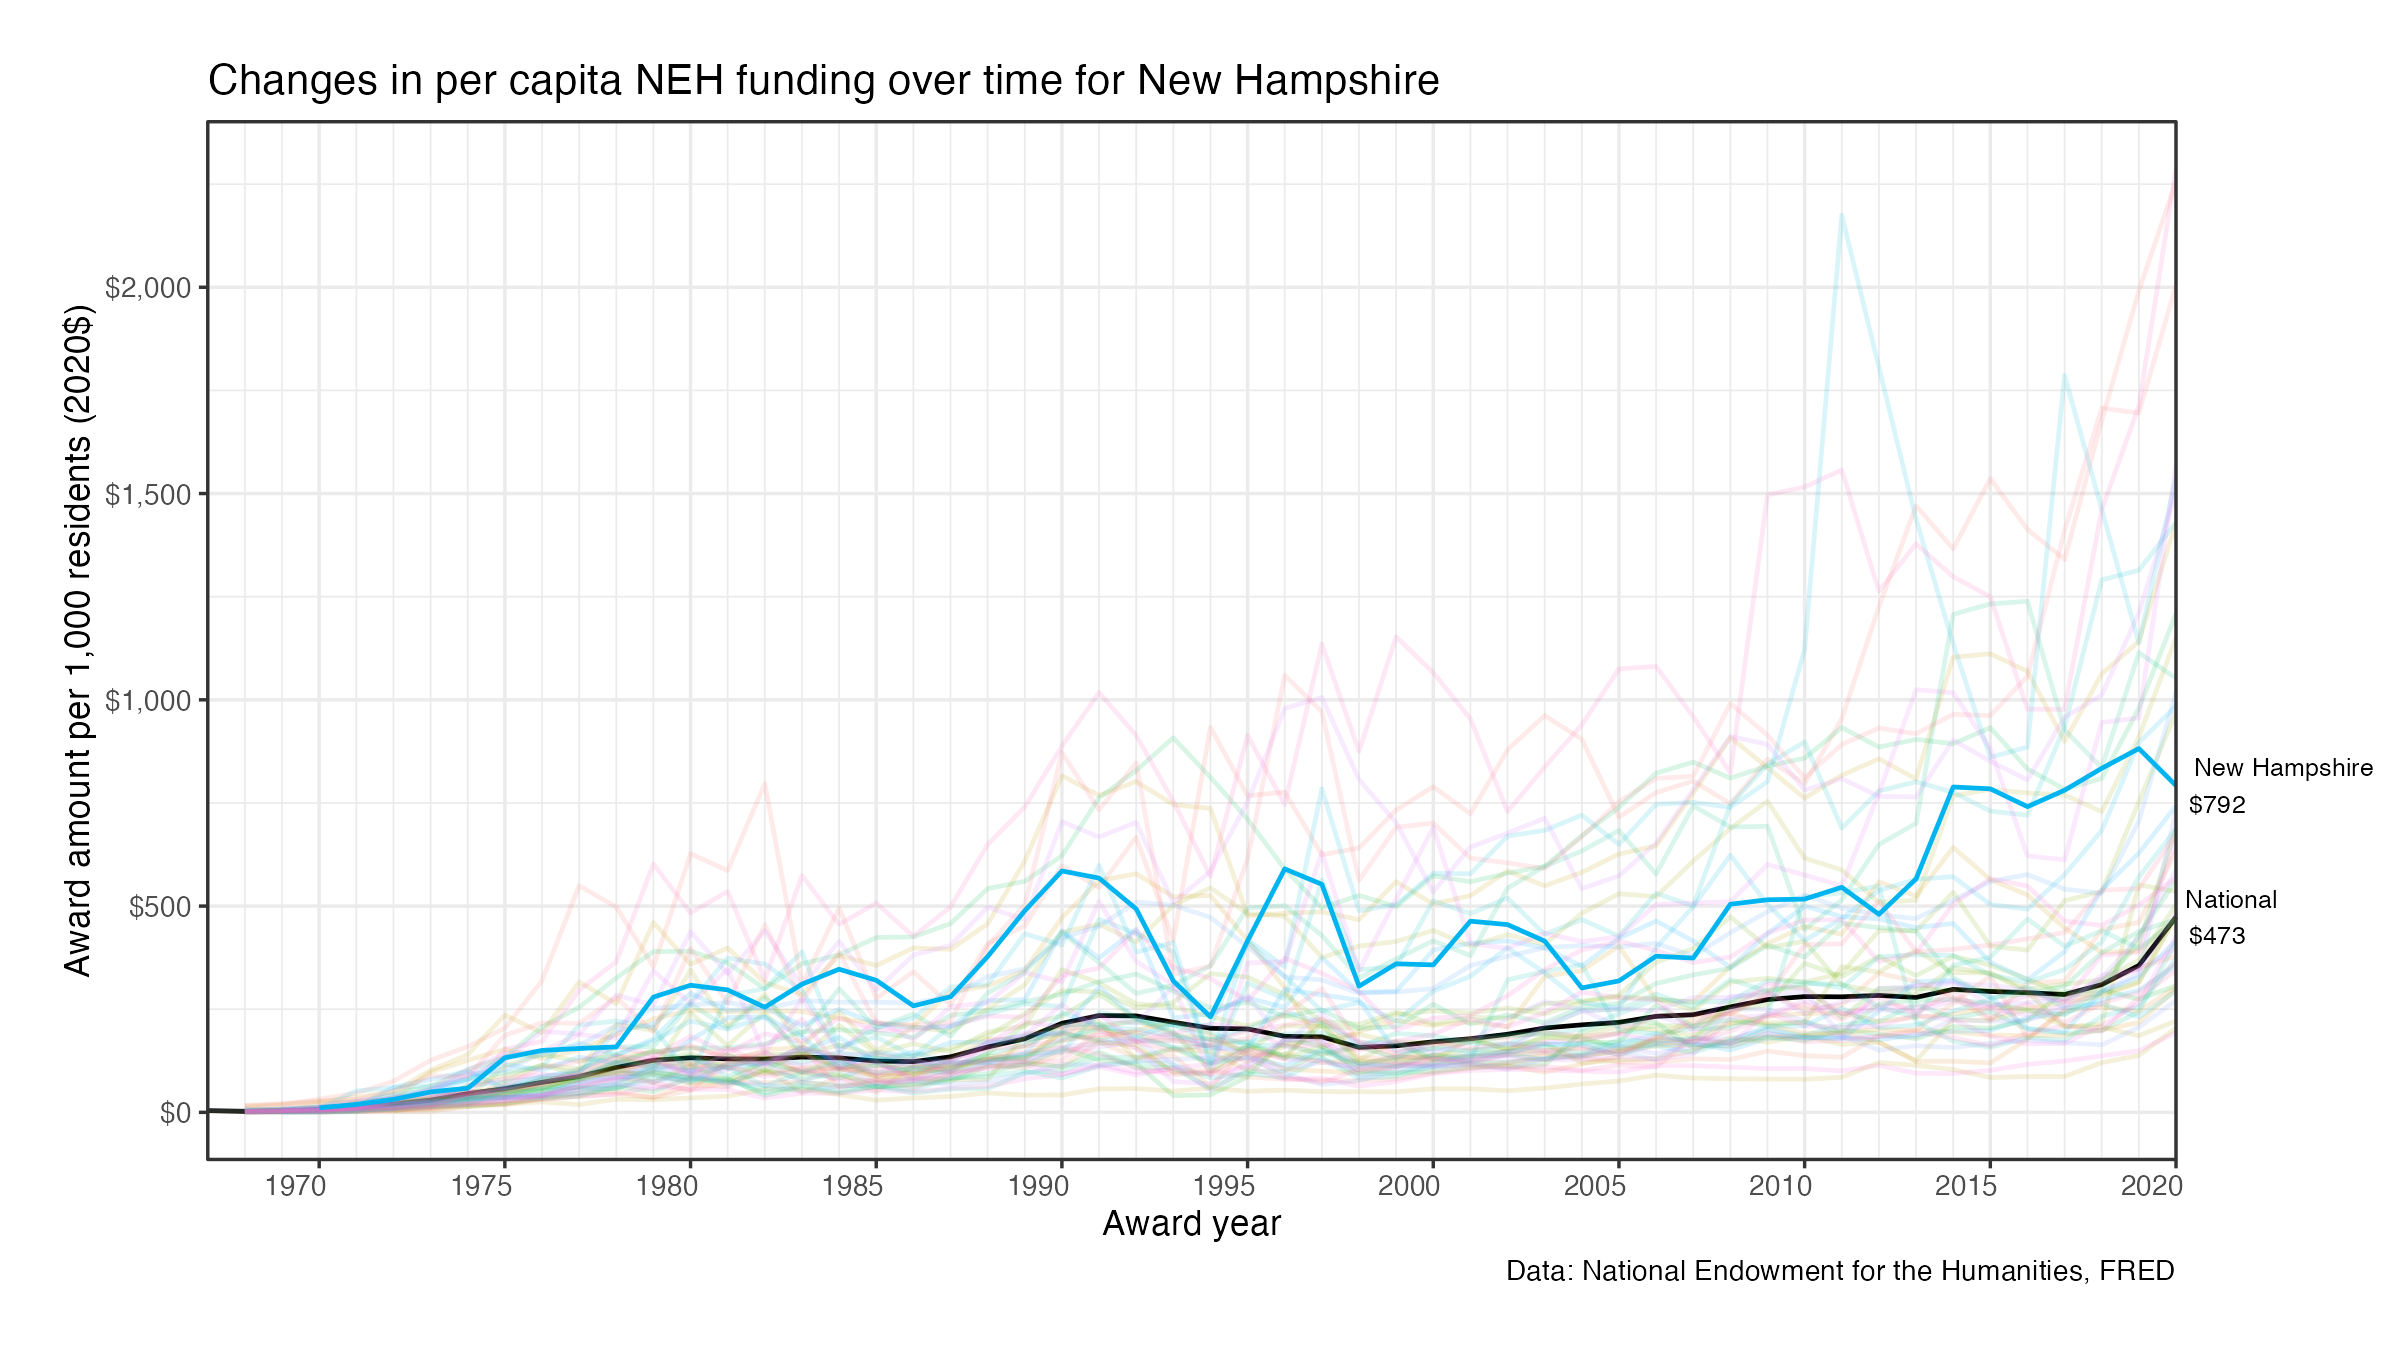
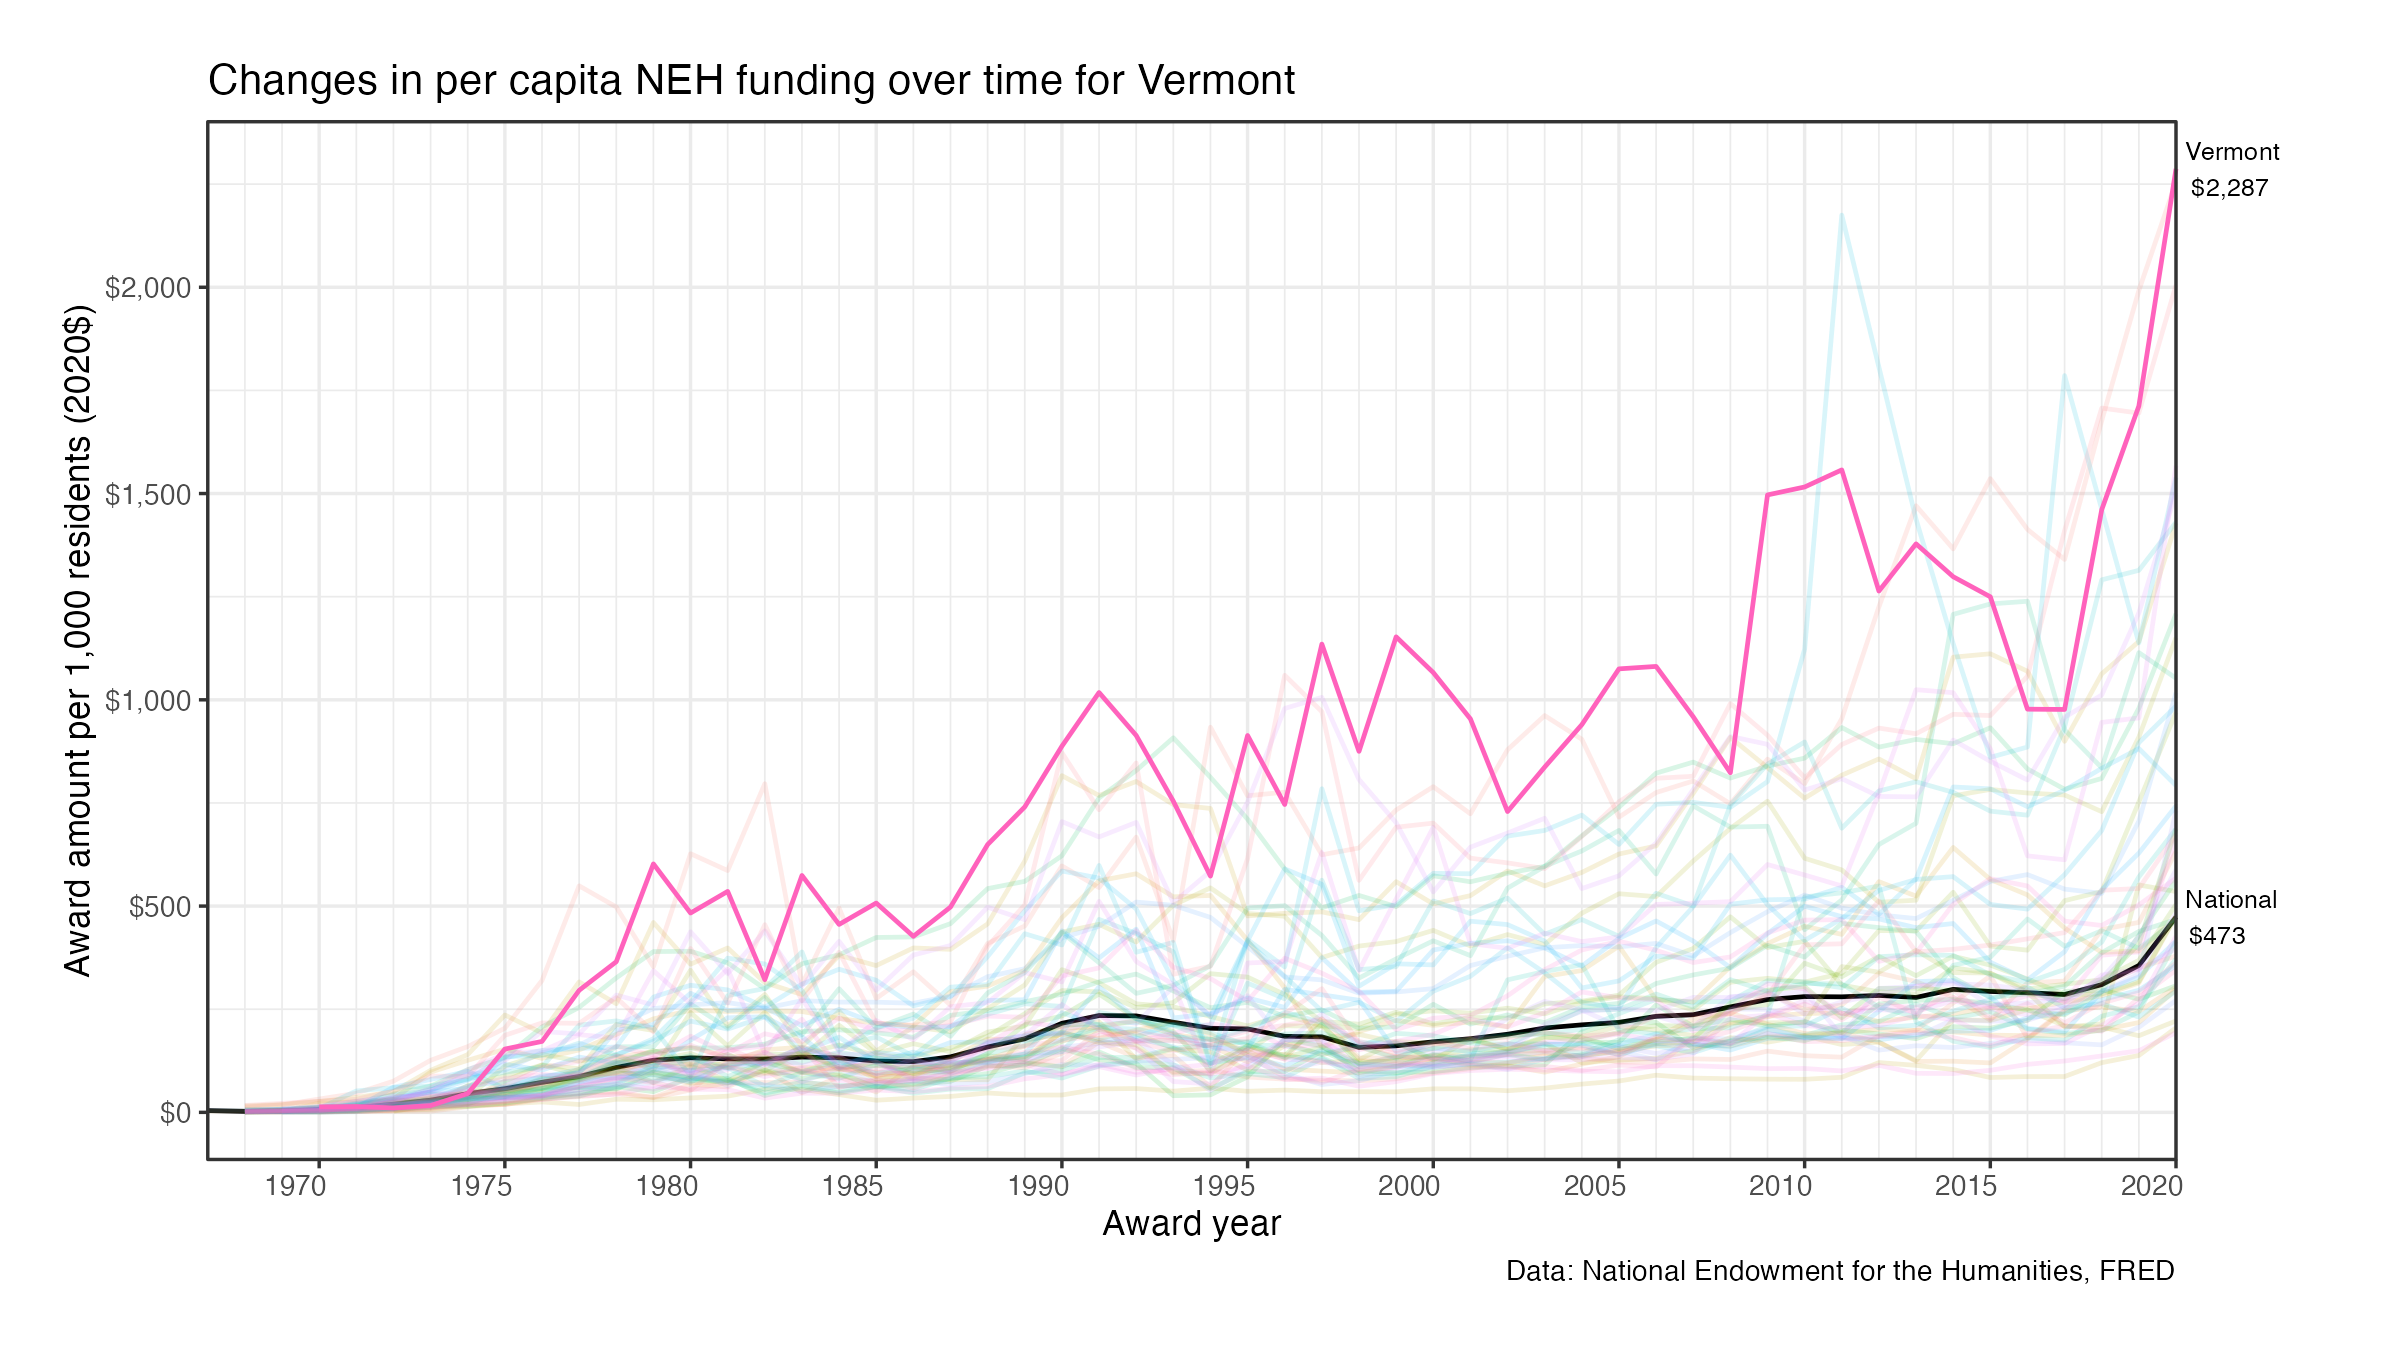
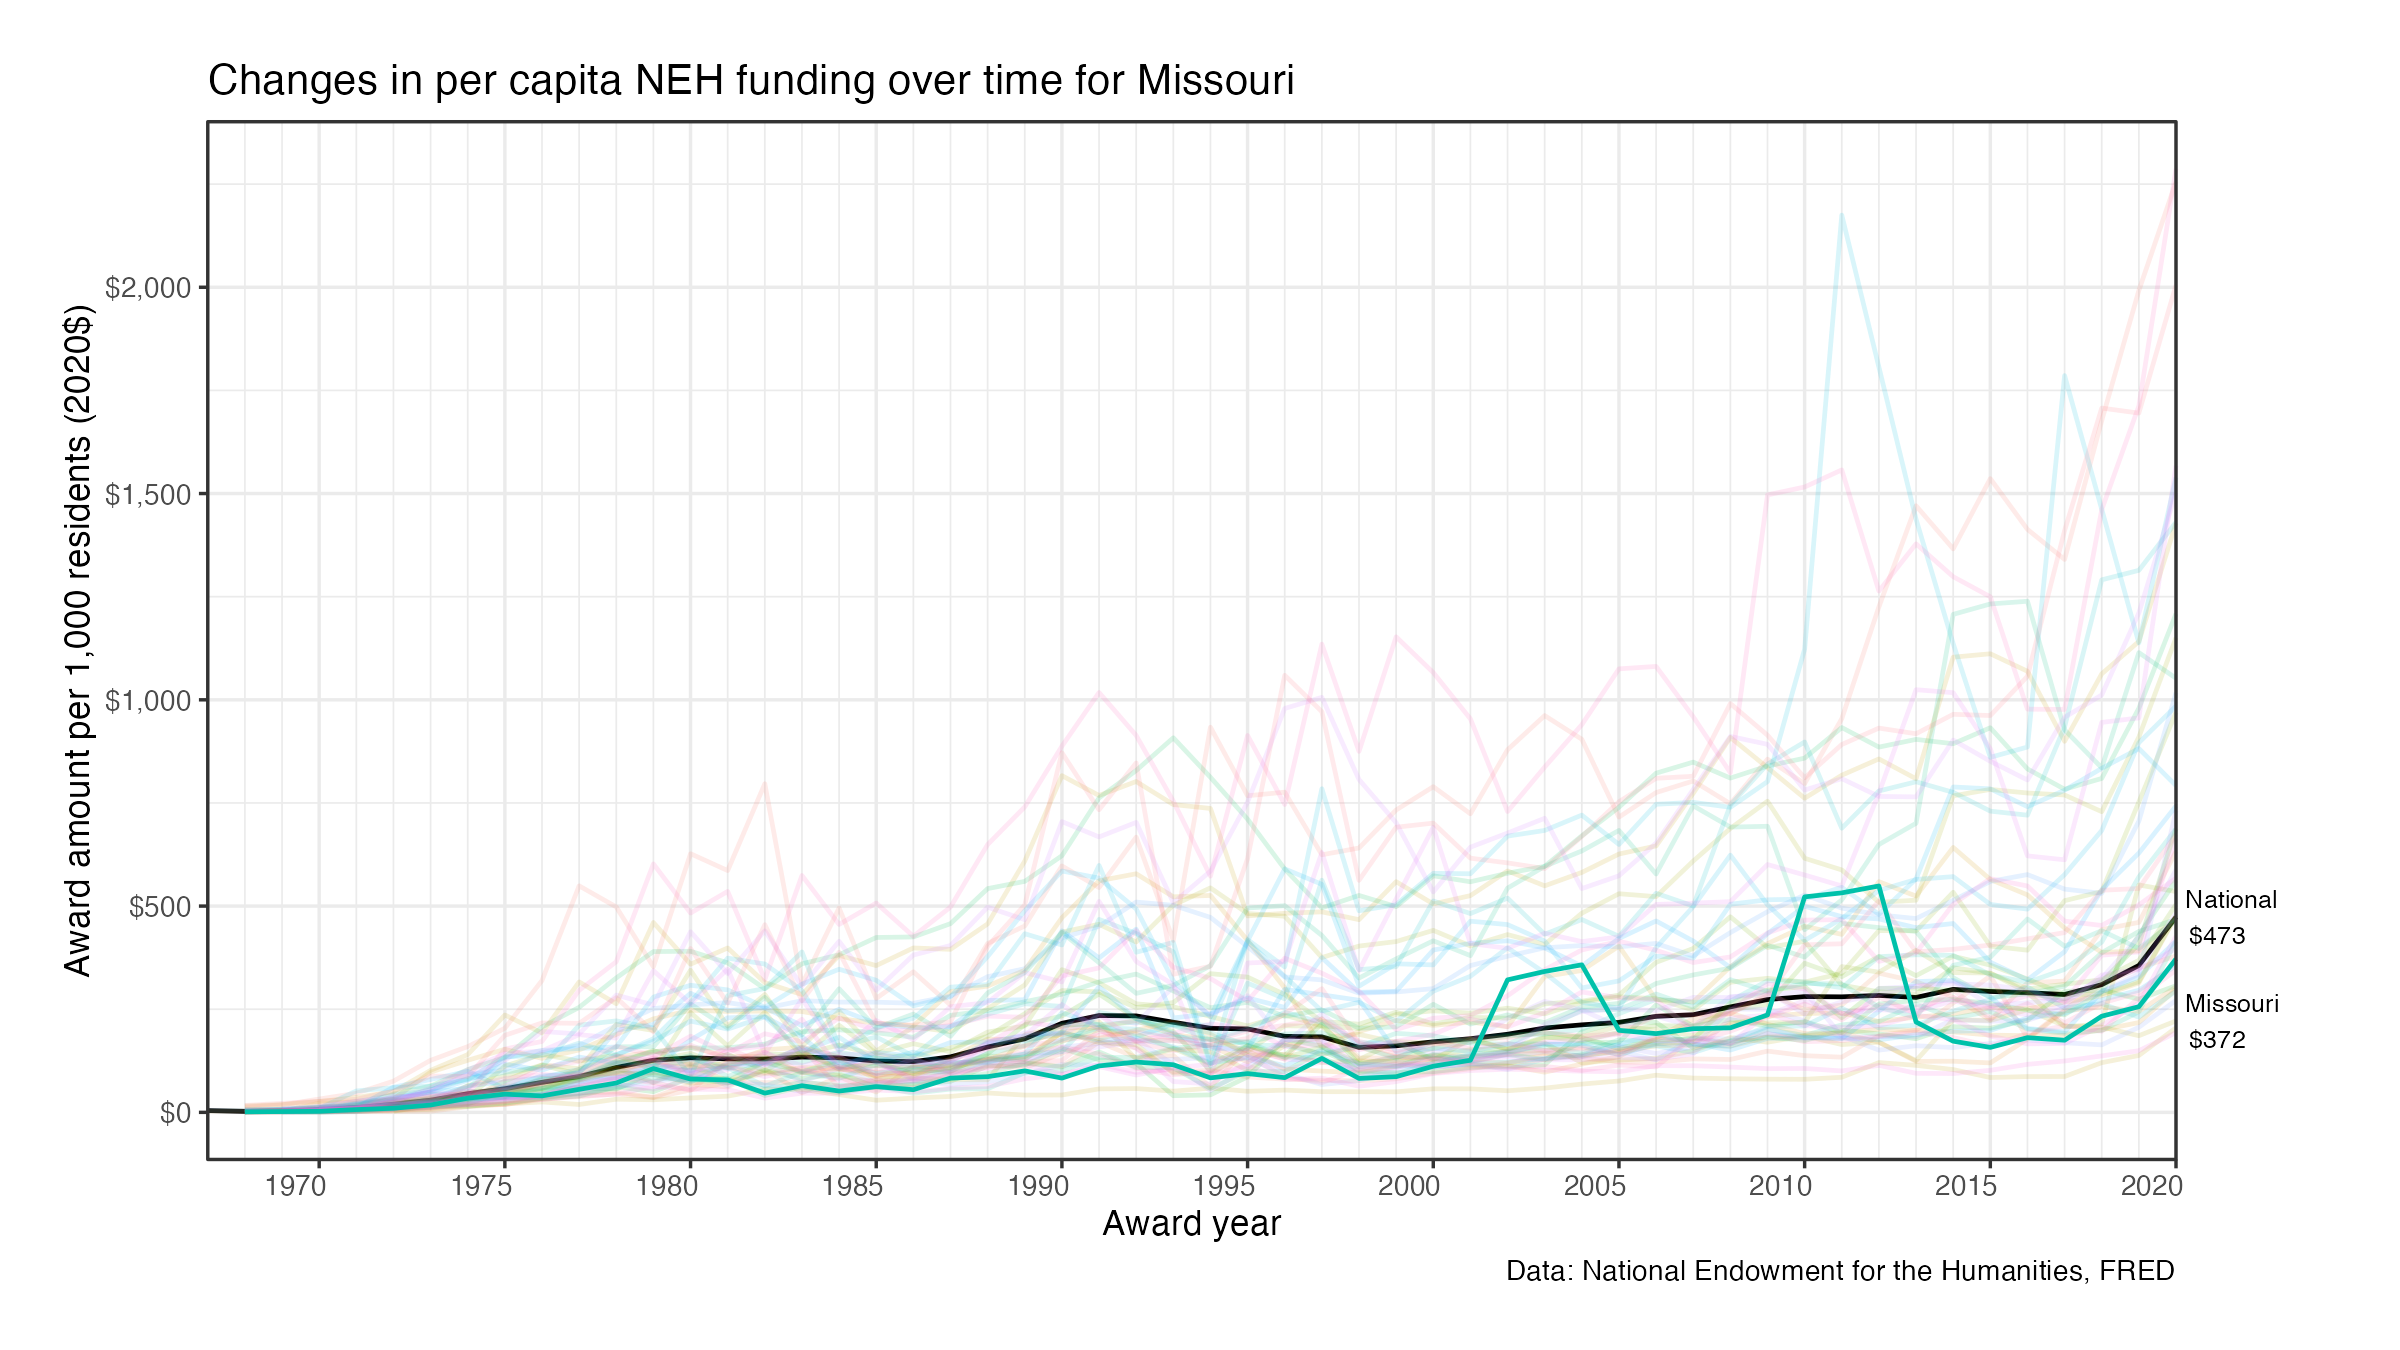
Established in the 1960s in the midst of the space race, the National Endowment for the Humanities has grown from an initial endowment of $20 million to awarding nearly $200 million in FY2020. Among domestically awarded grants, this represents $473 spent per 1,000 persons in the United States in 2020.
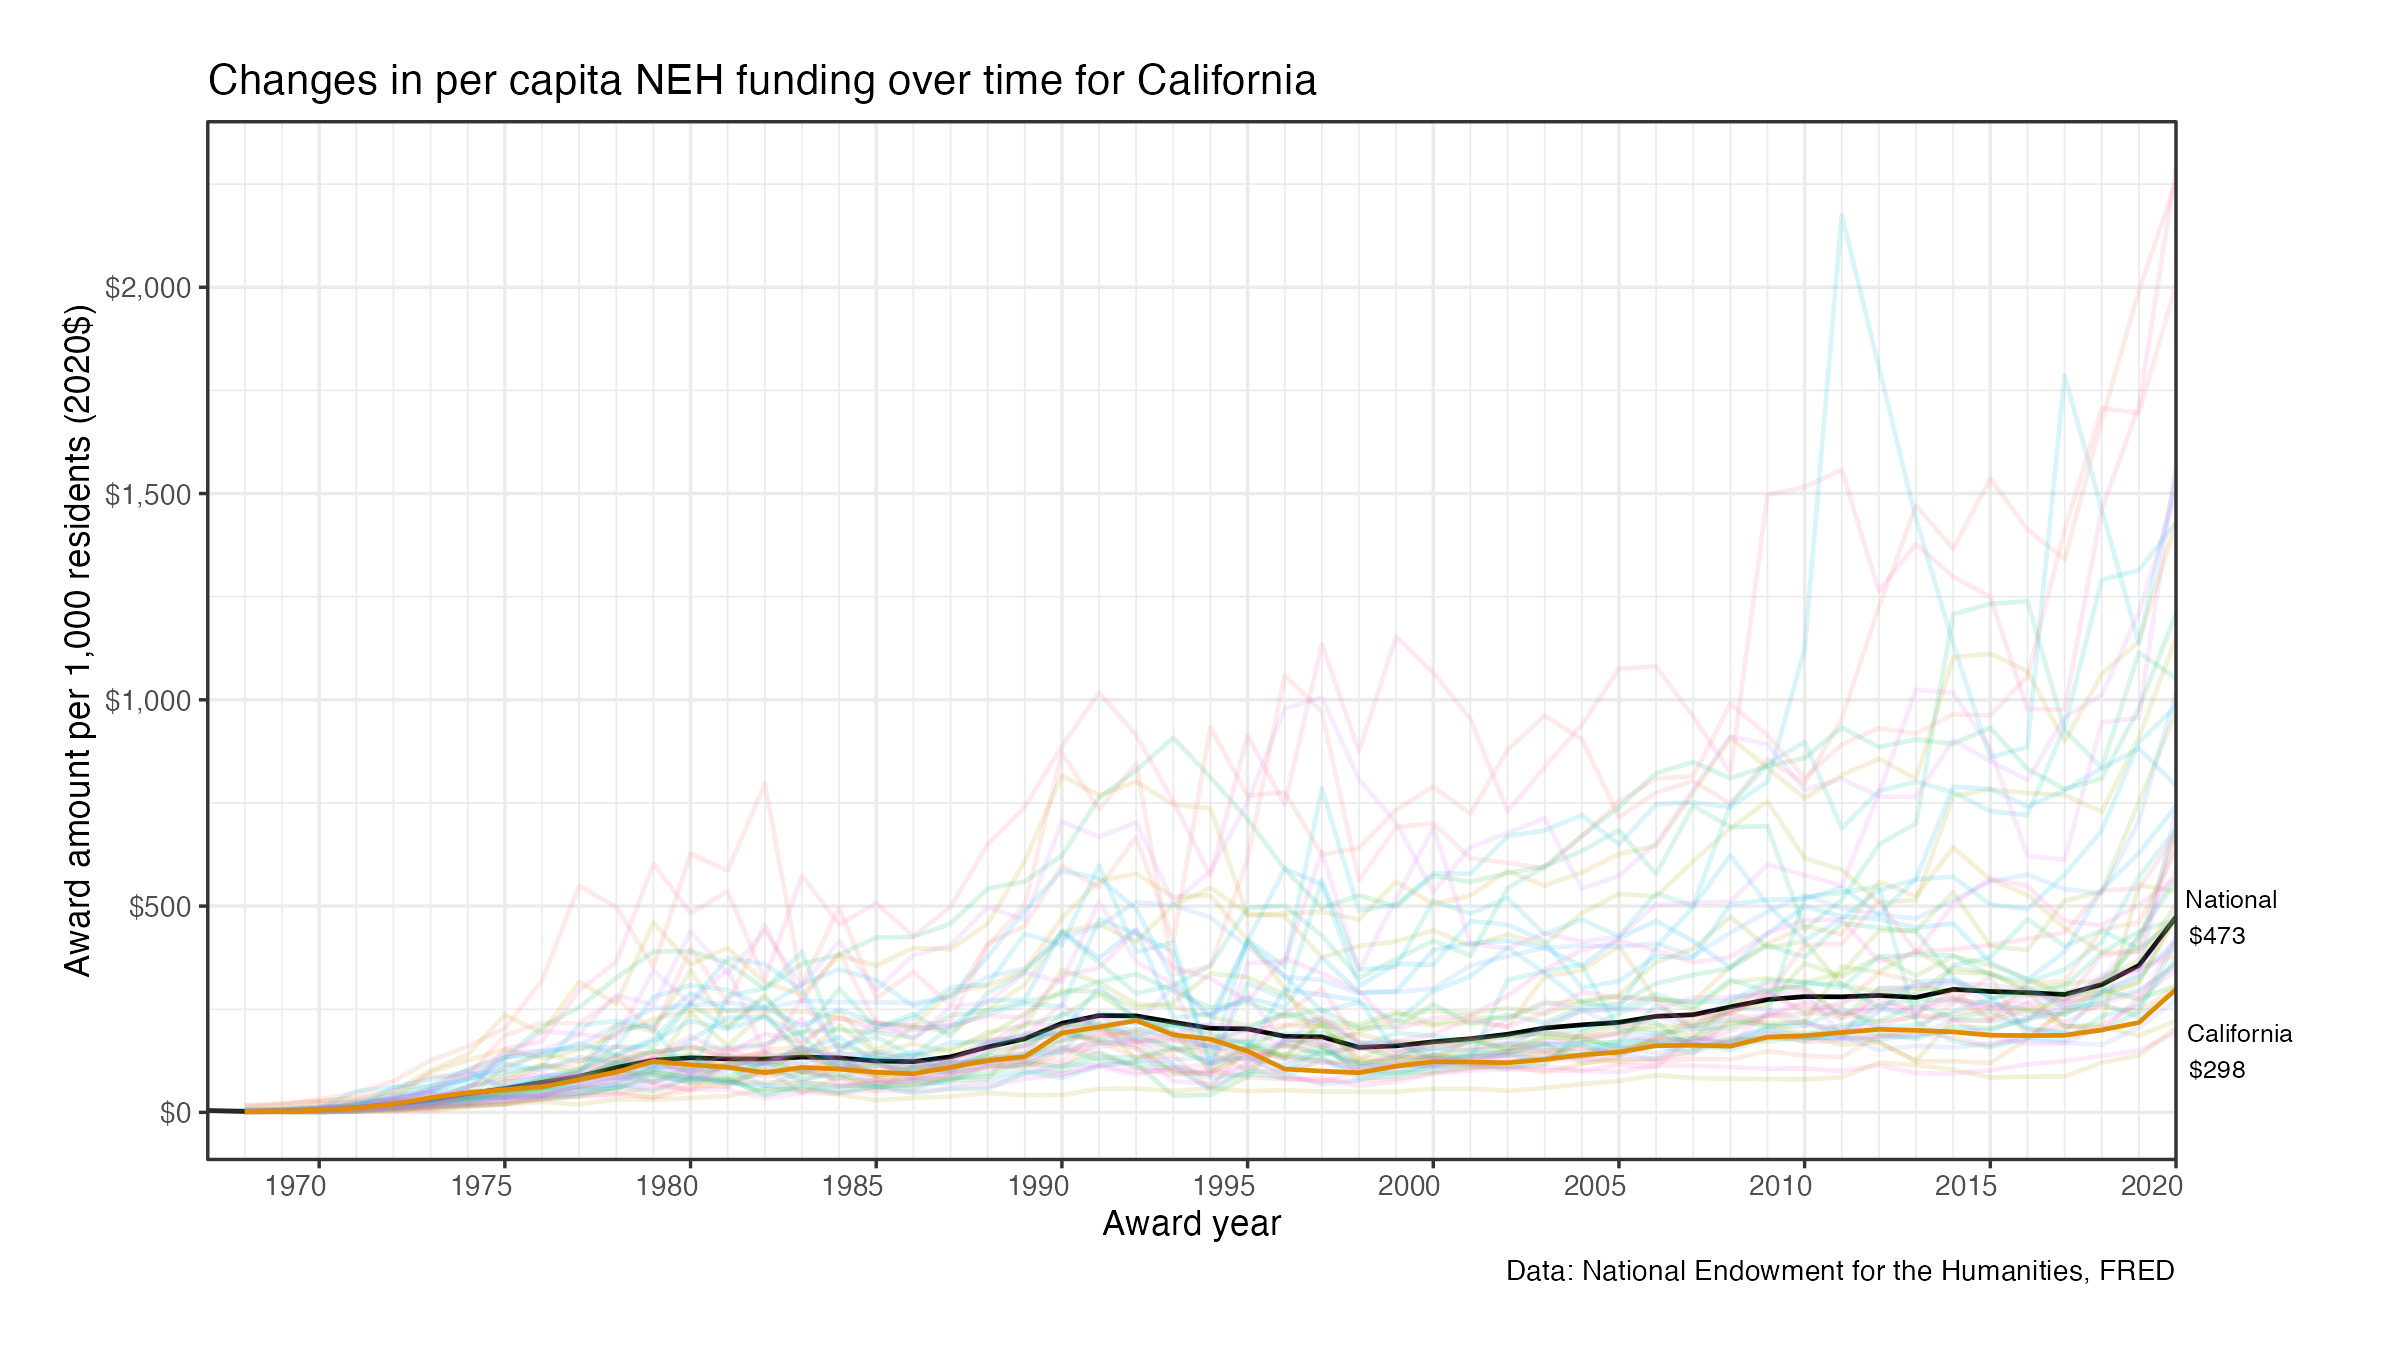
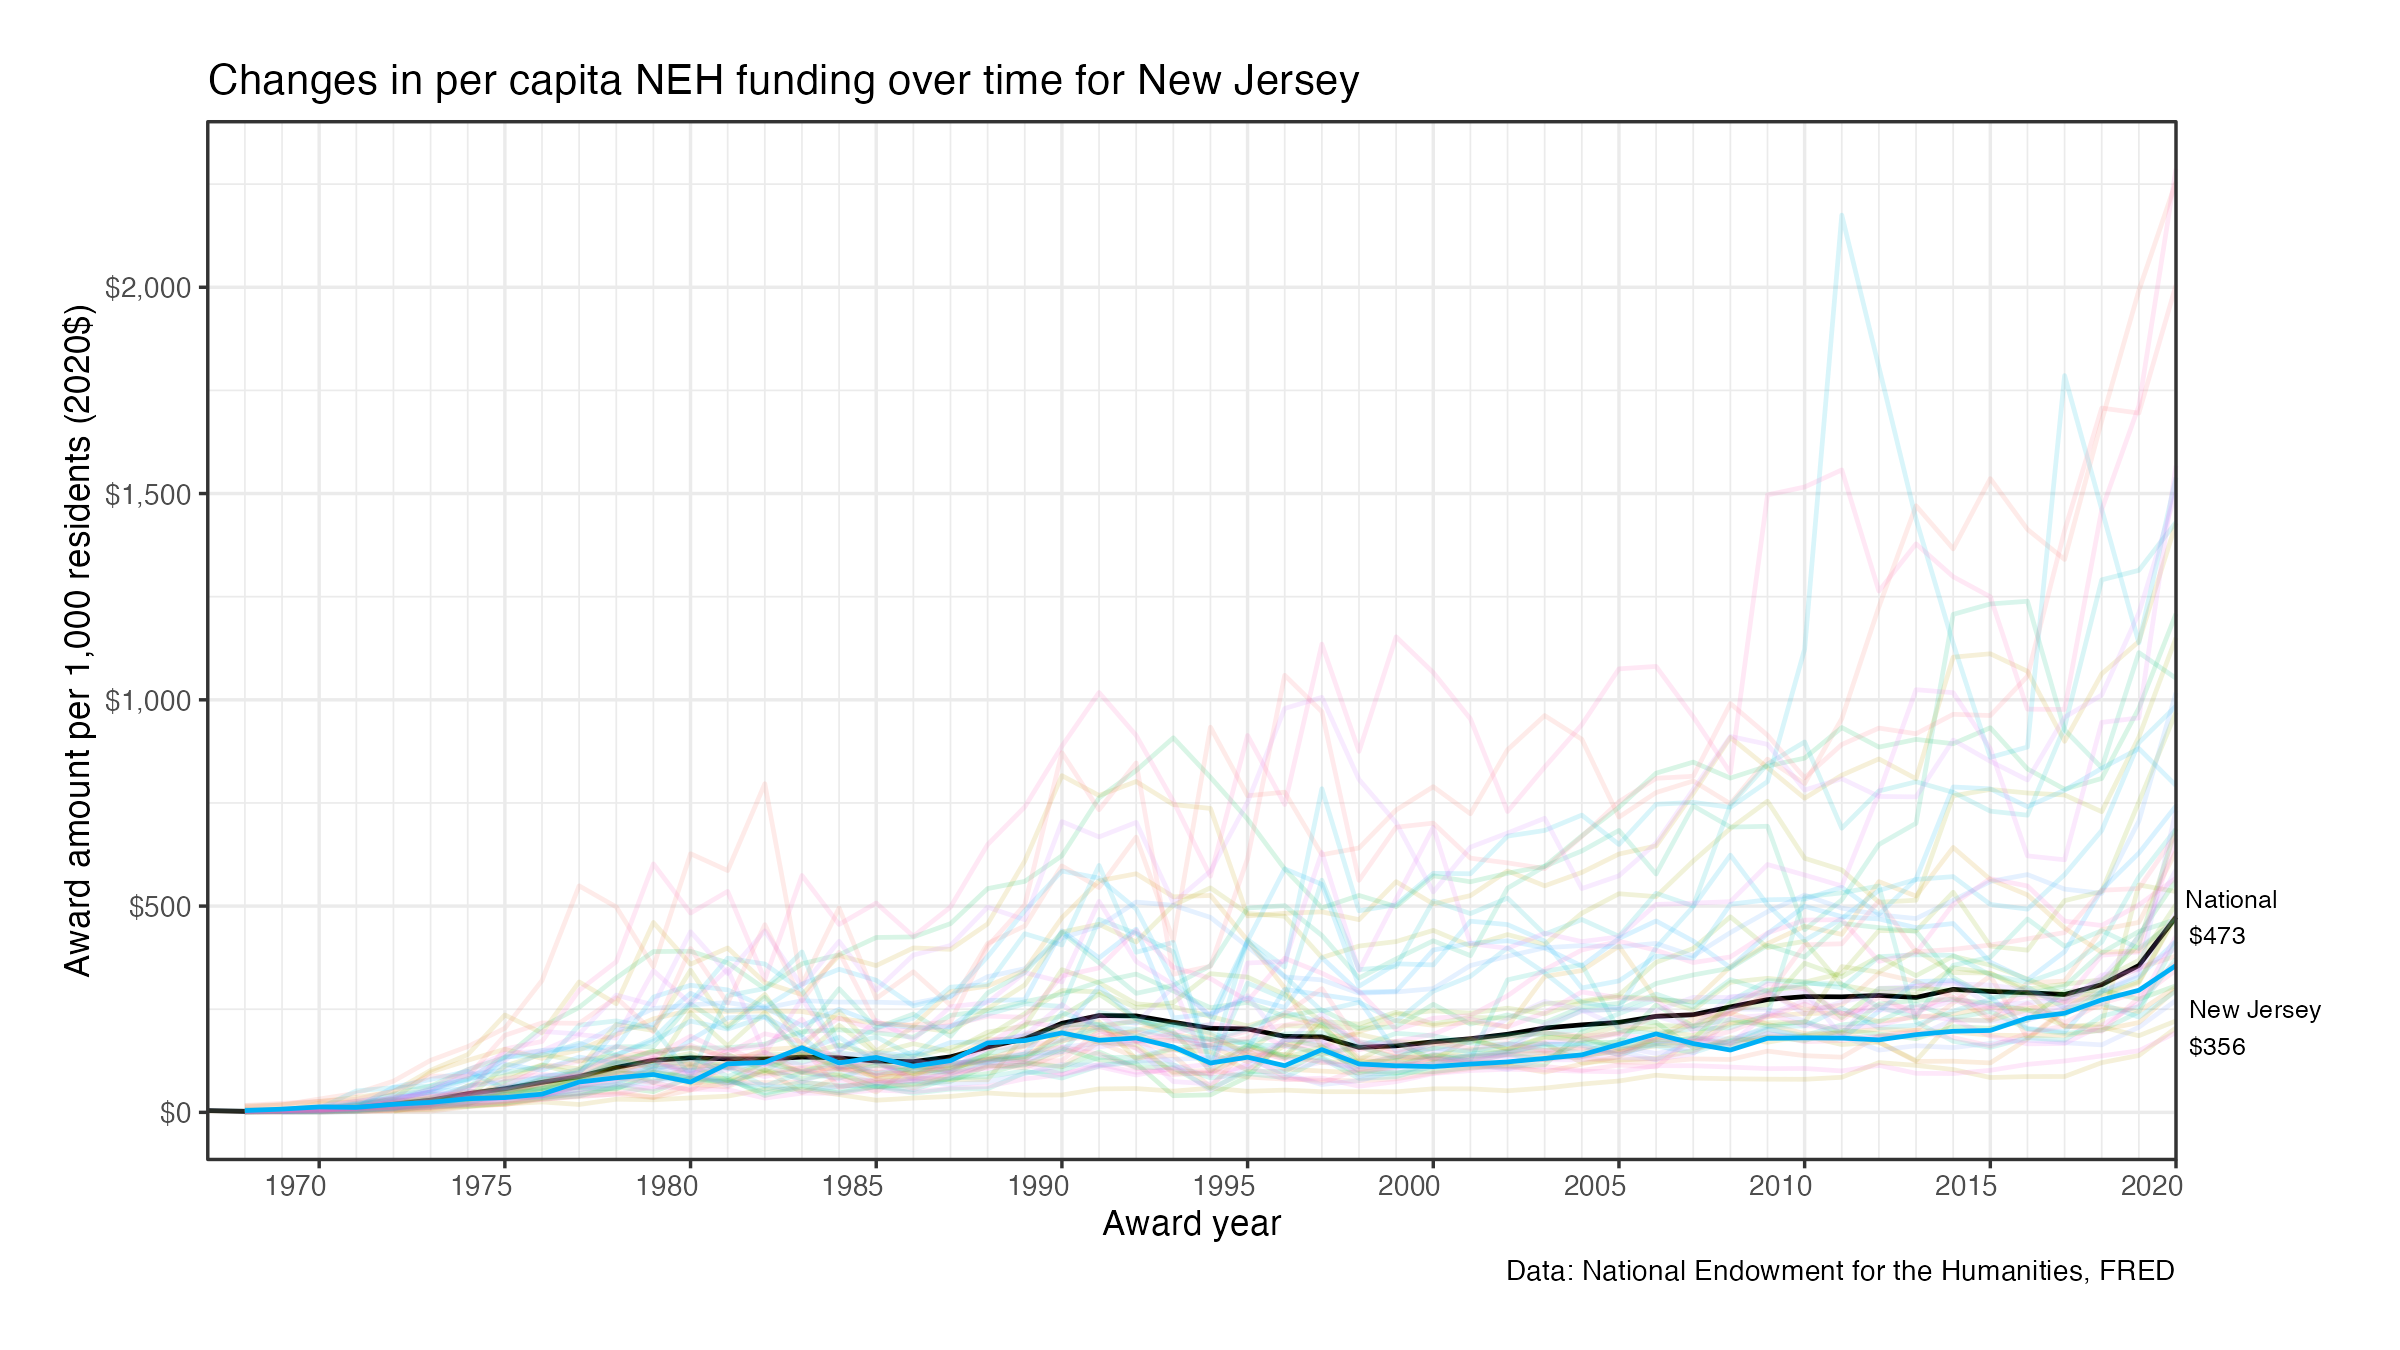
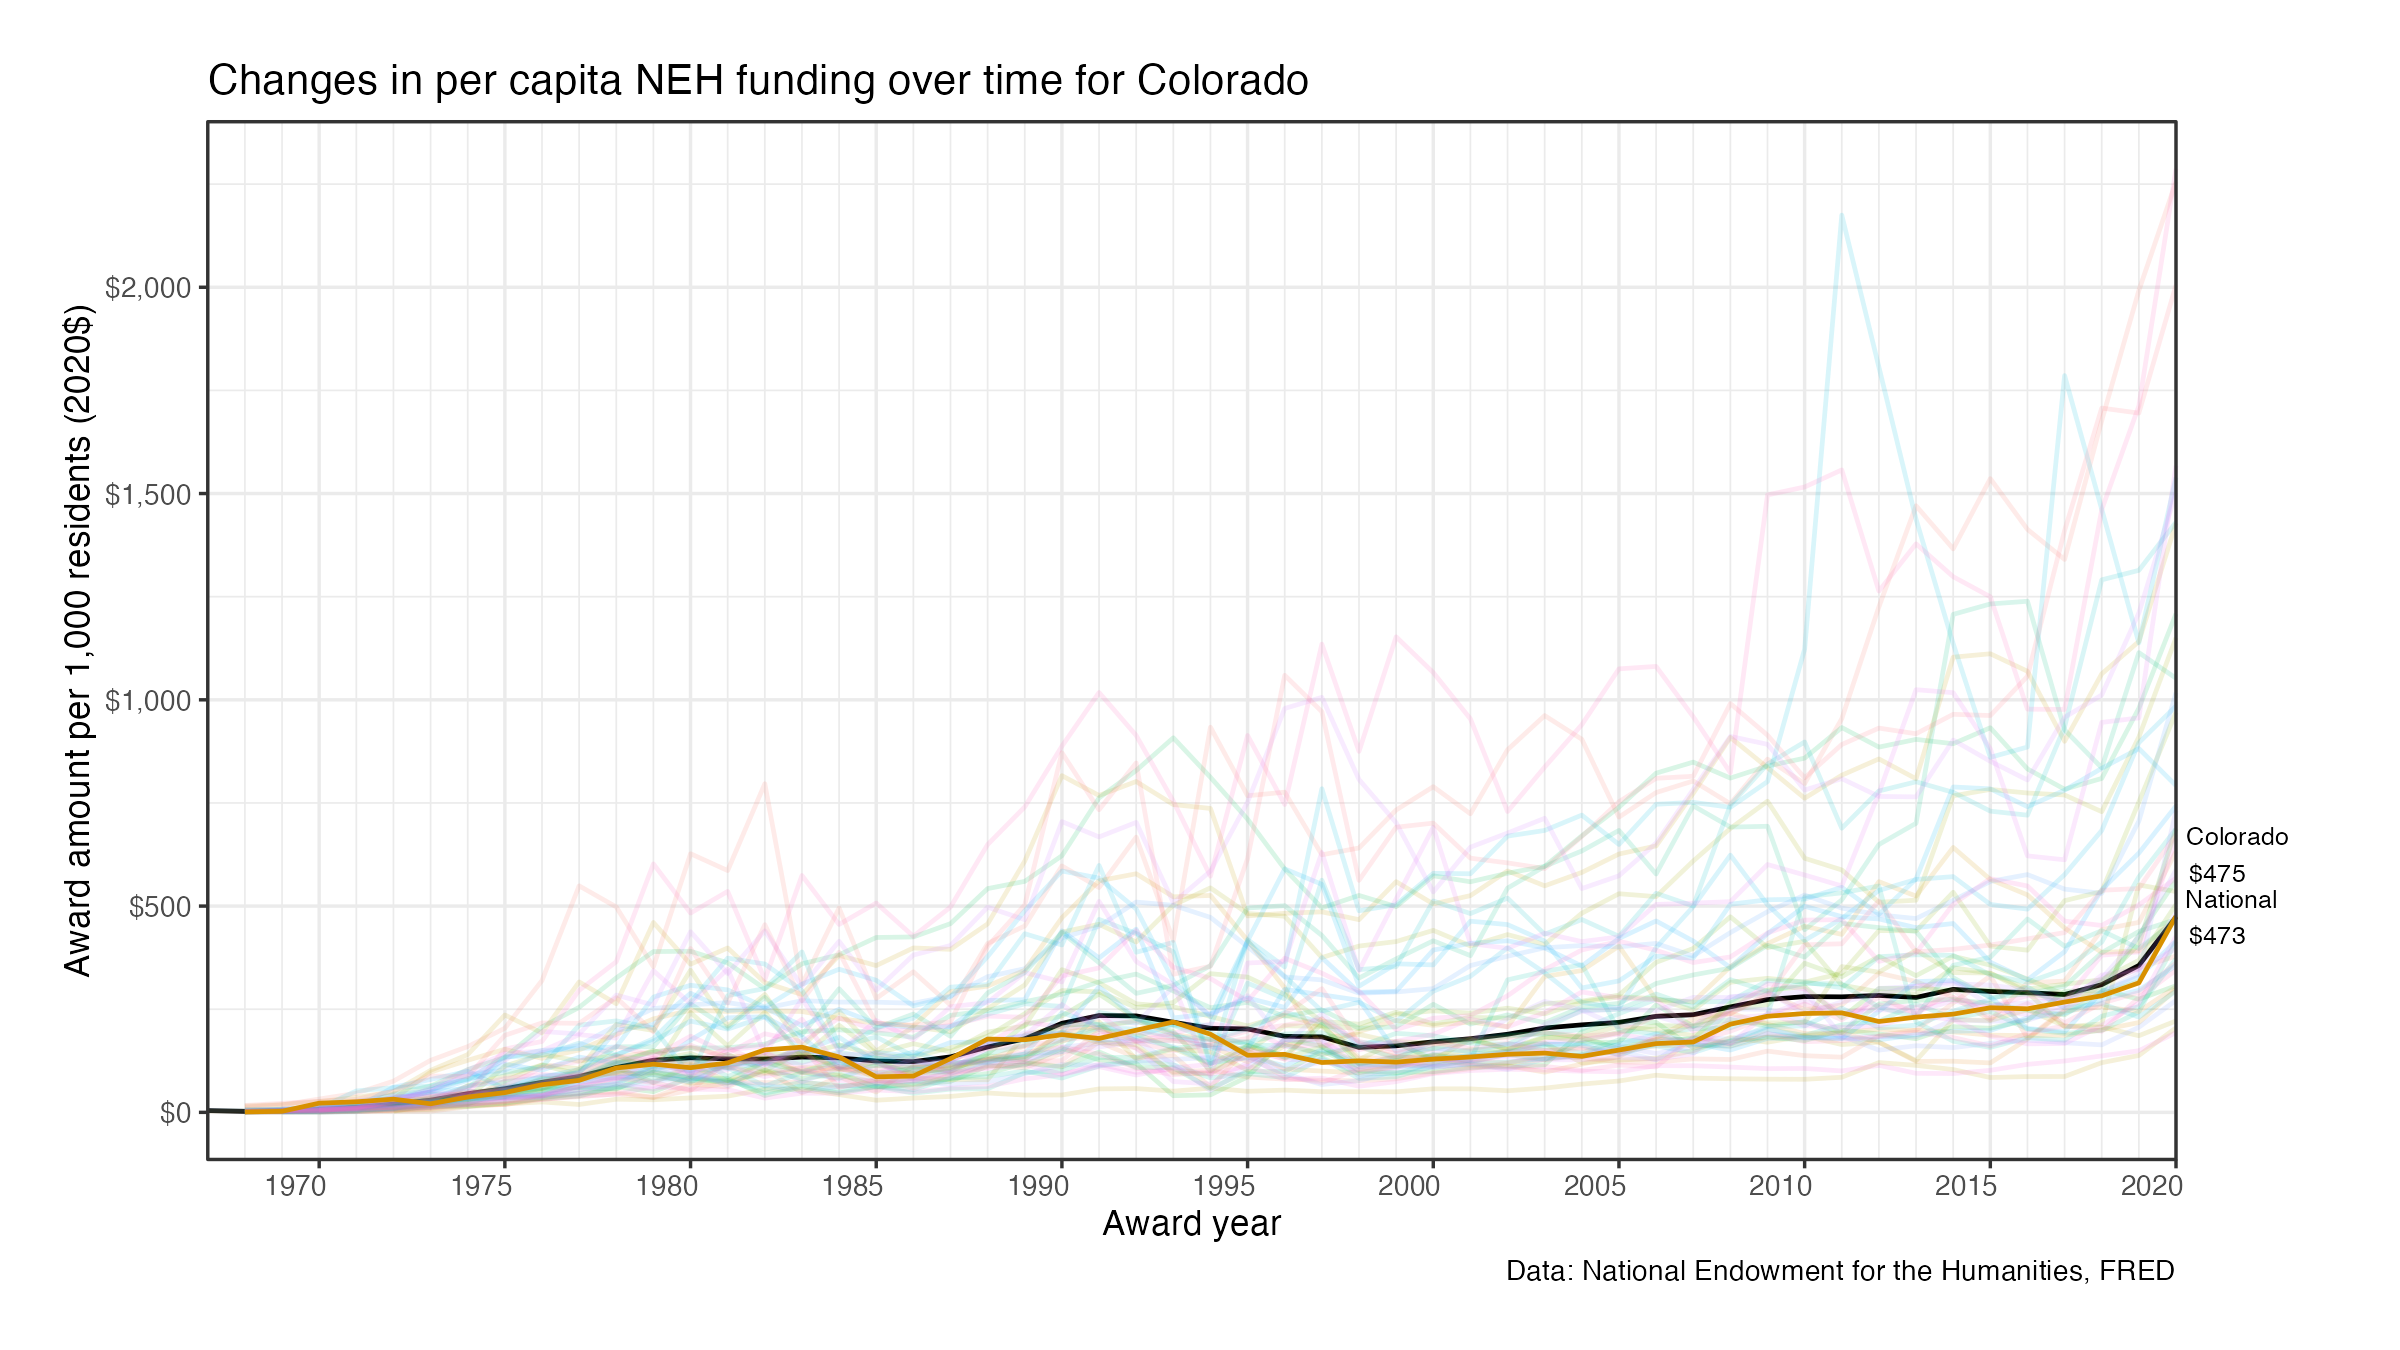
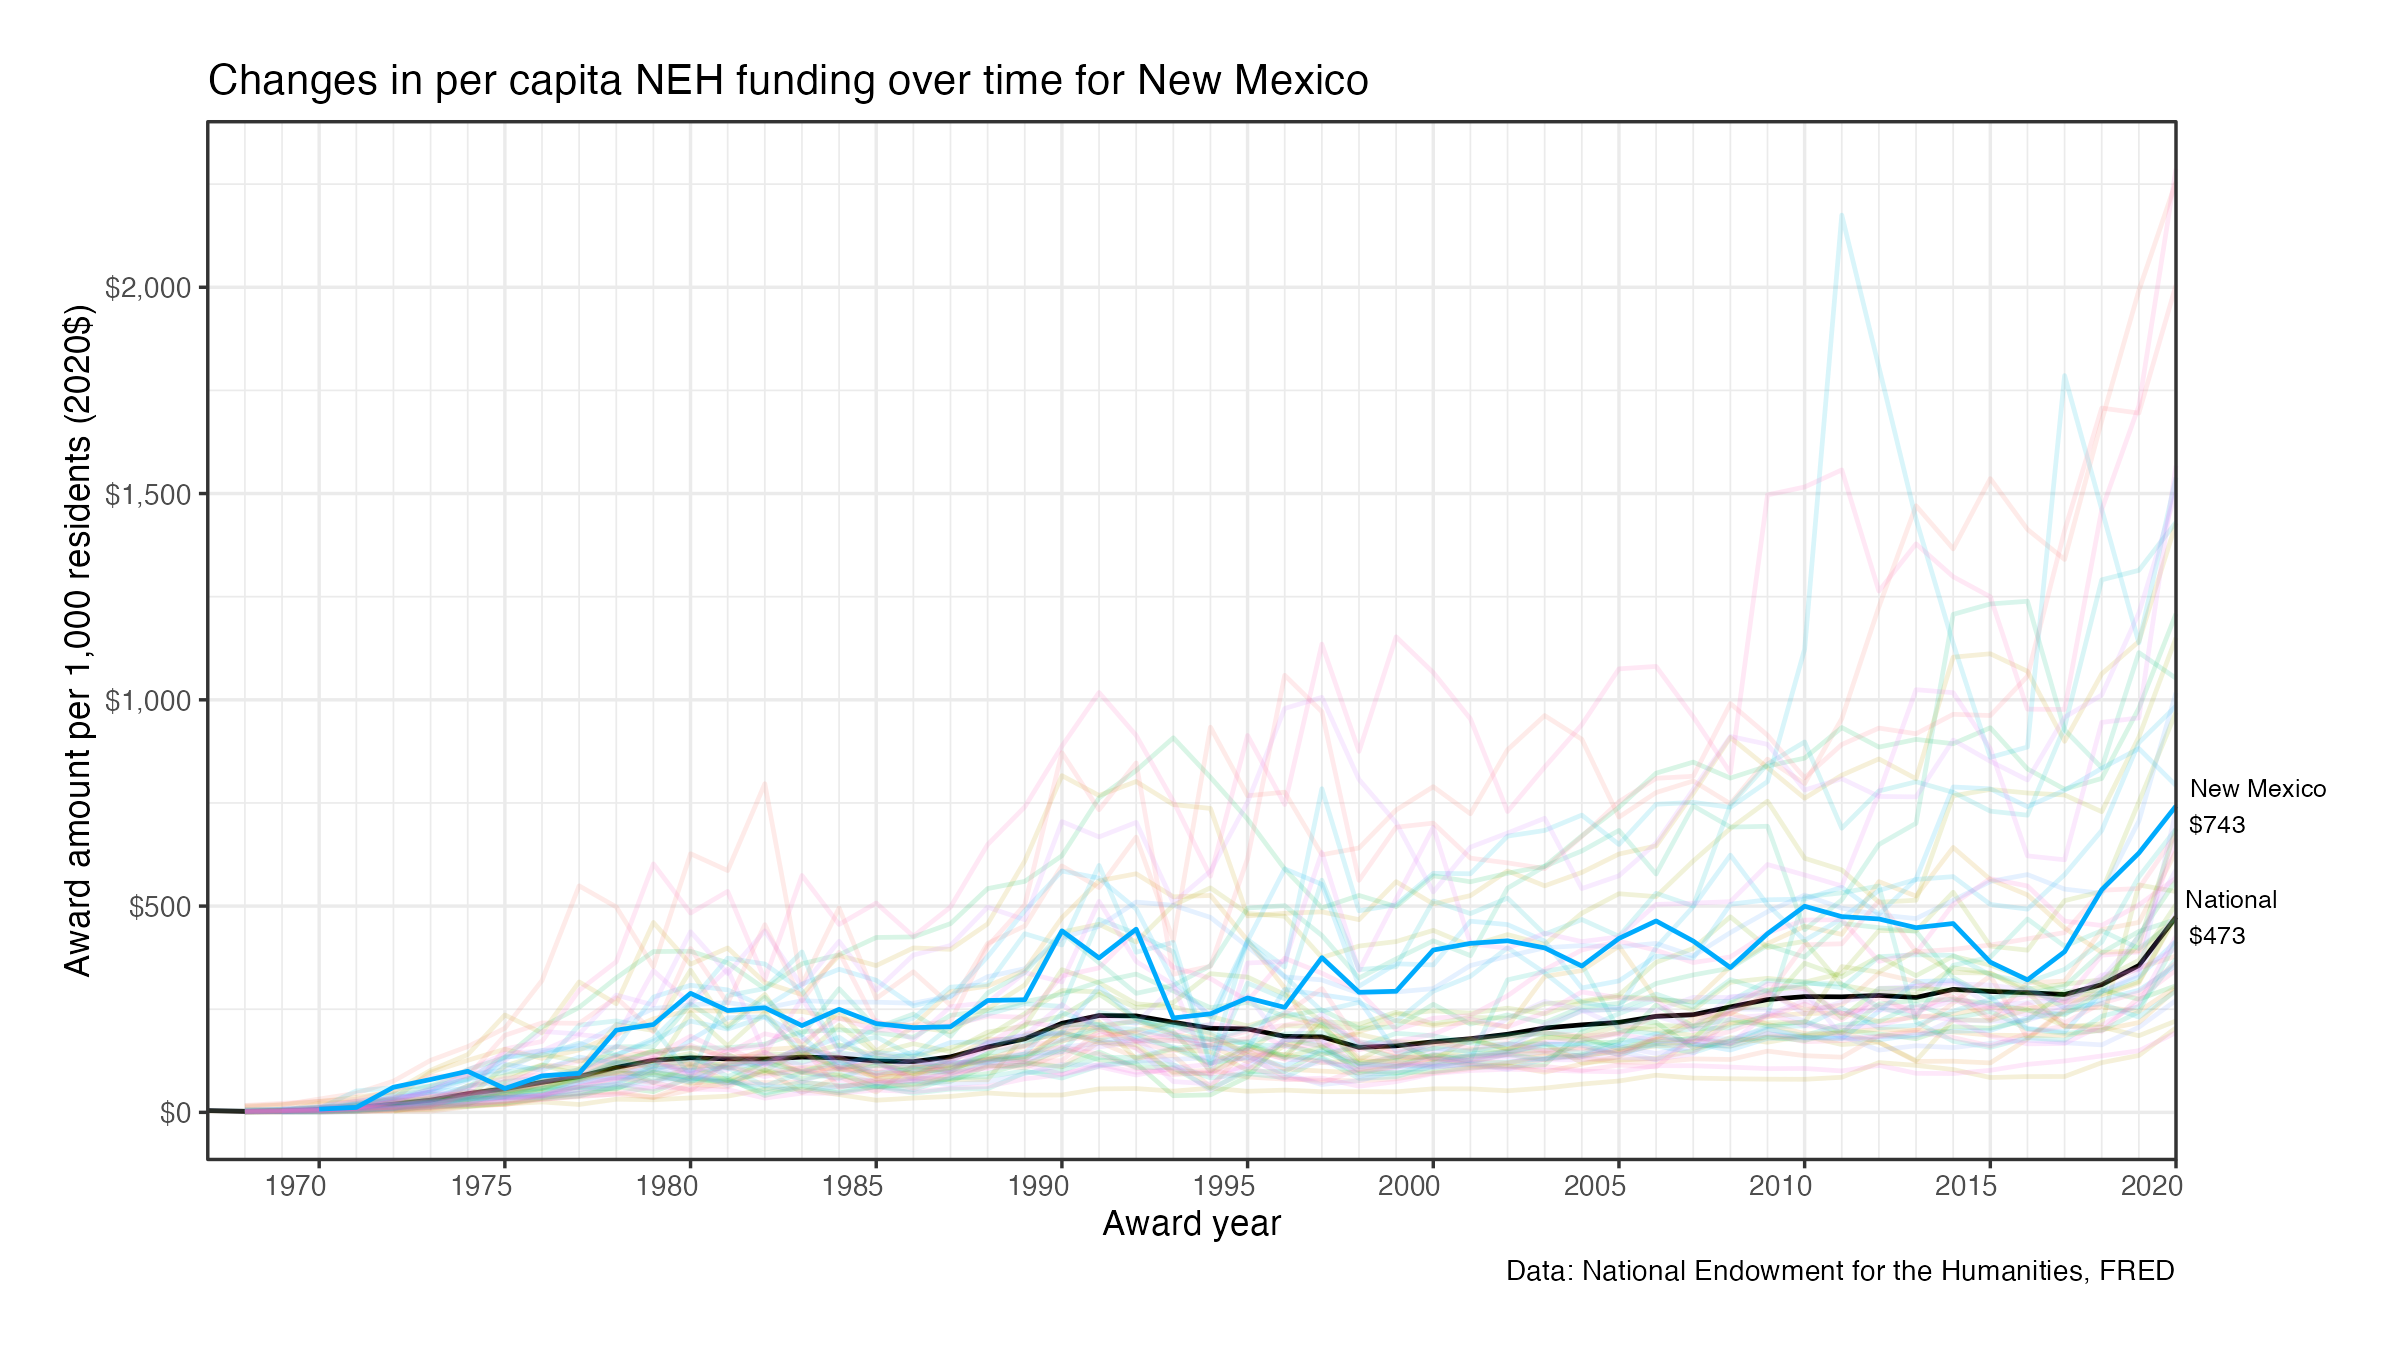
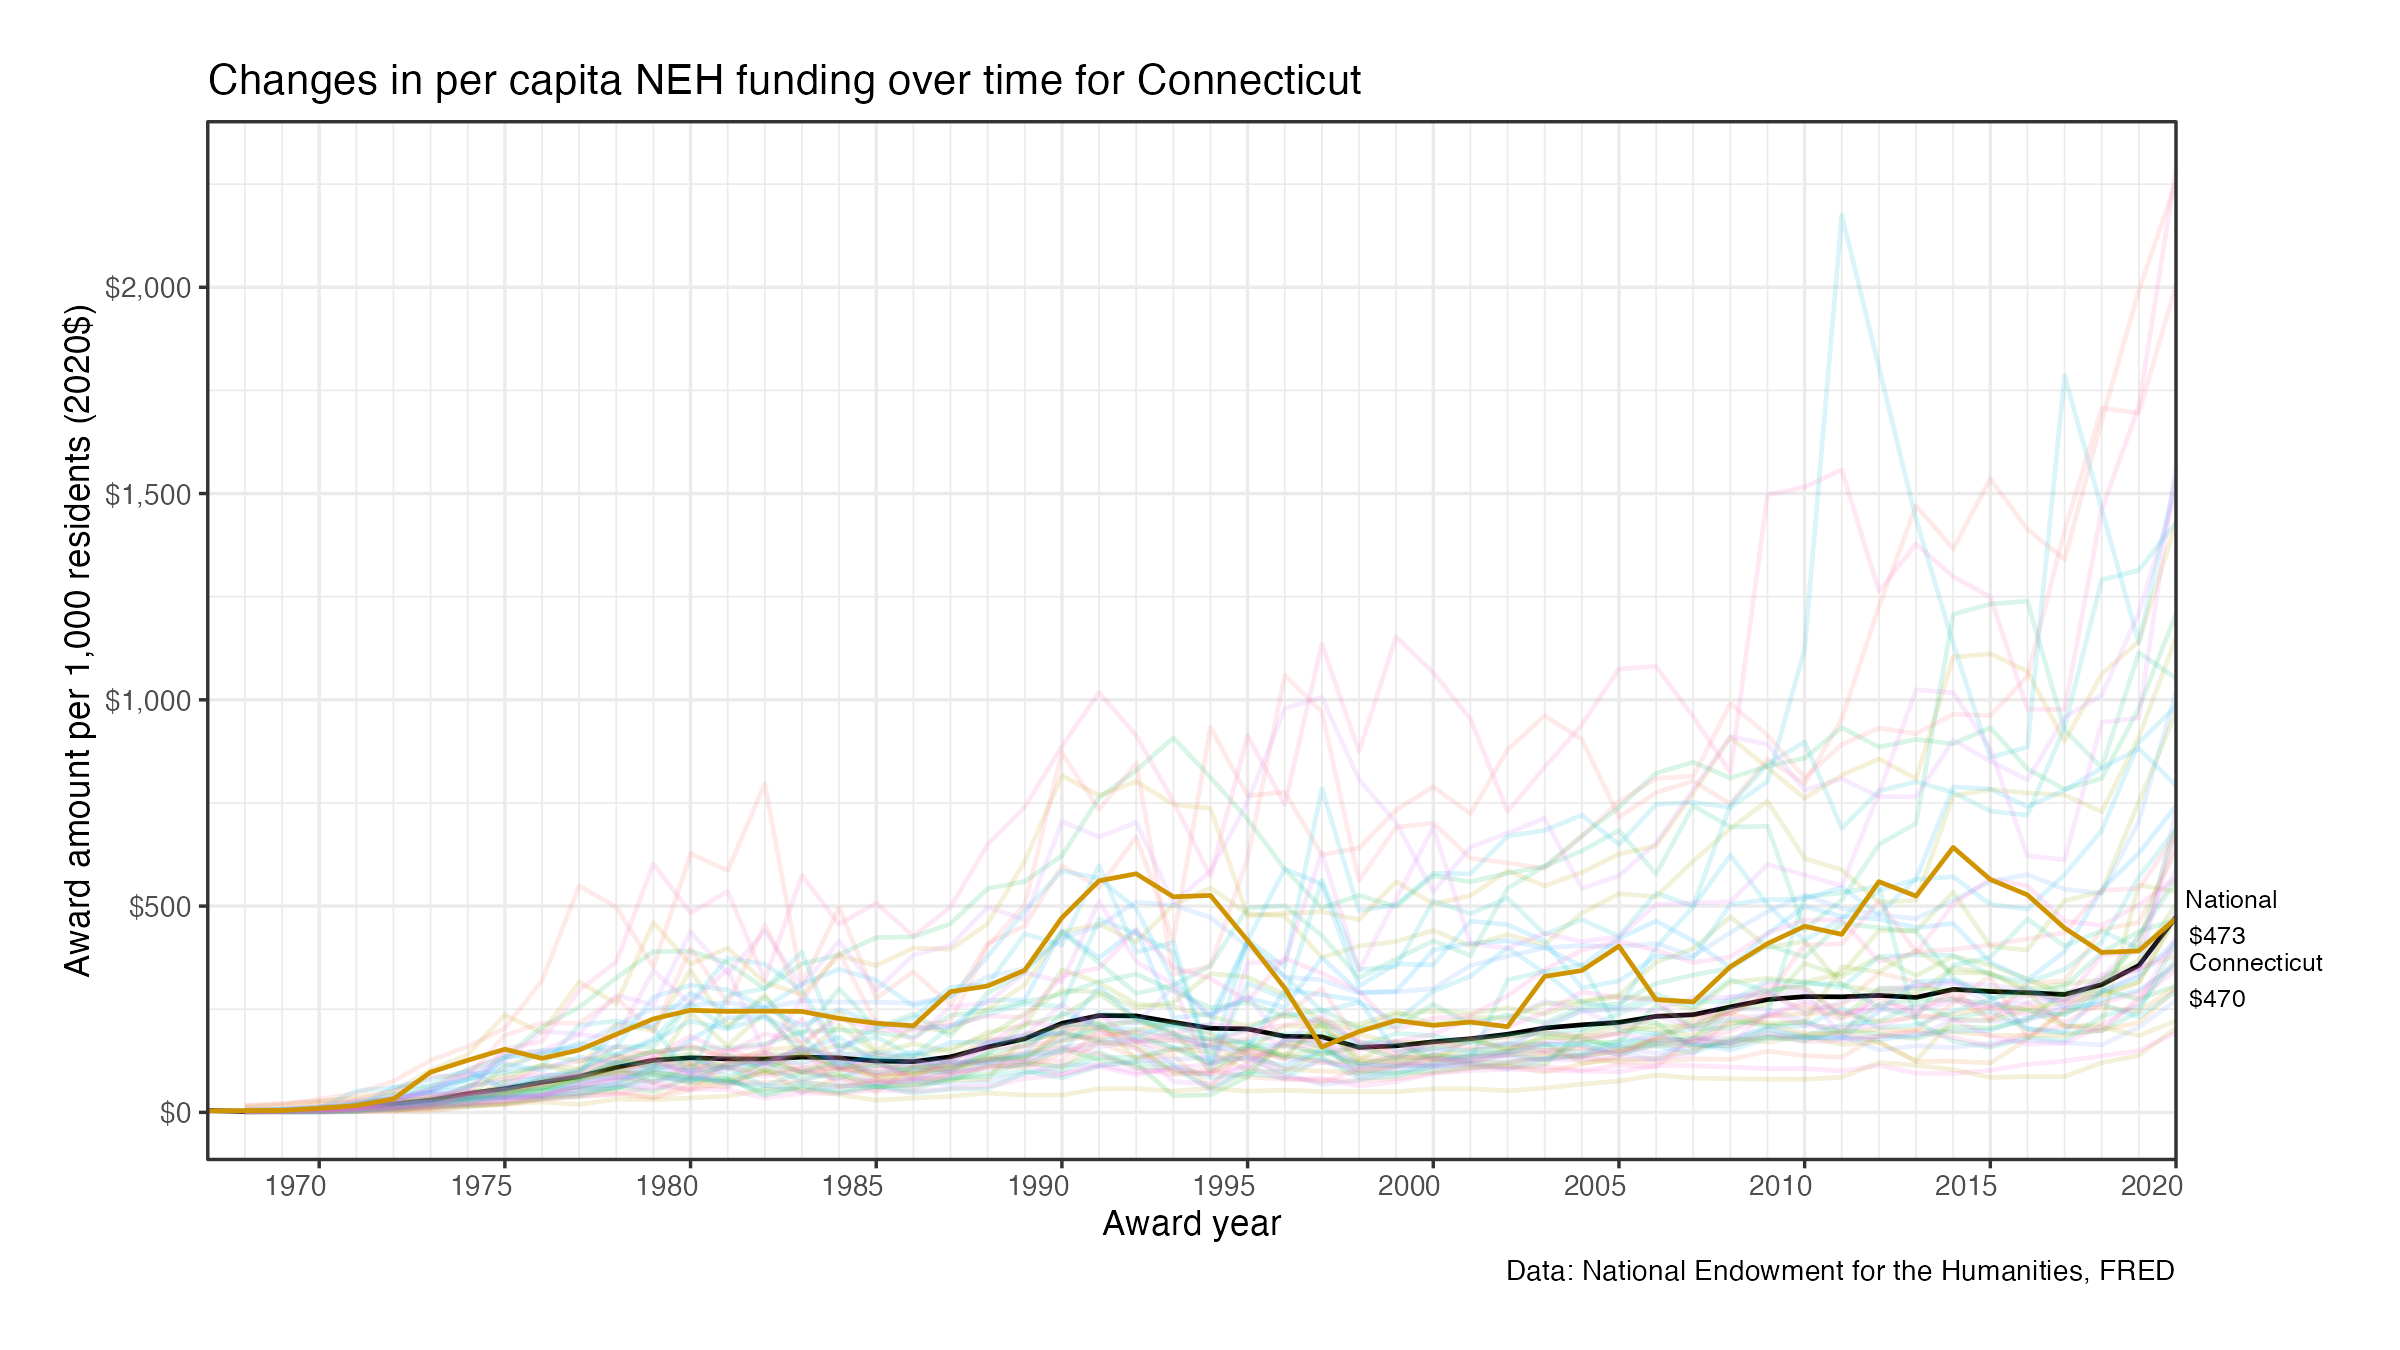
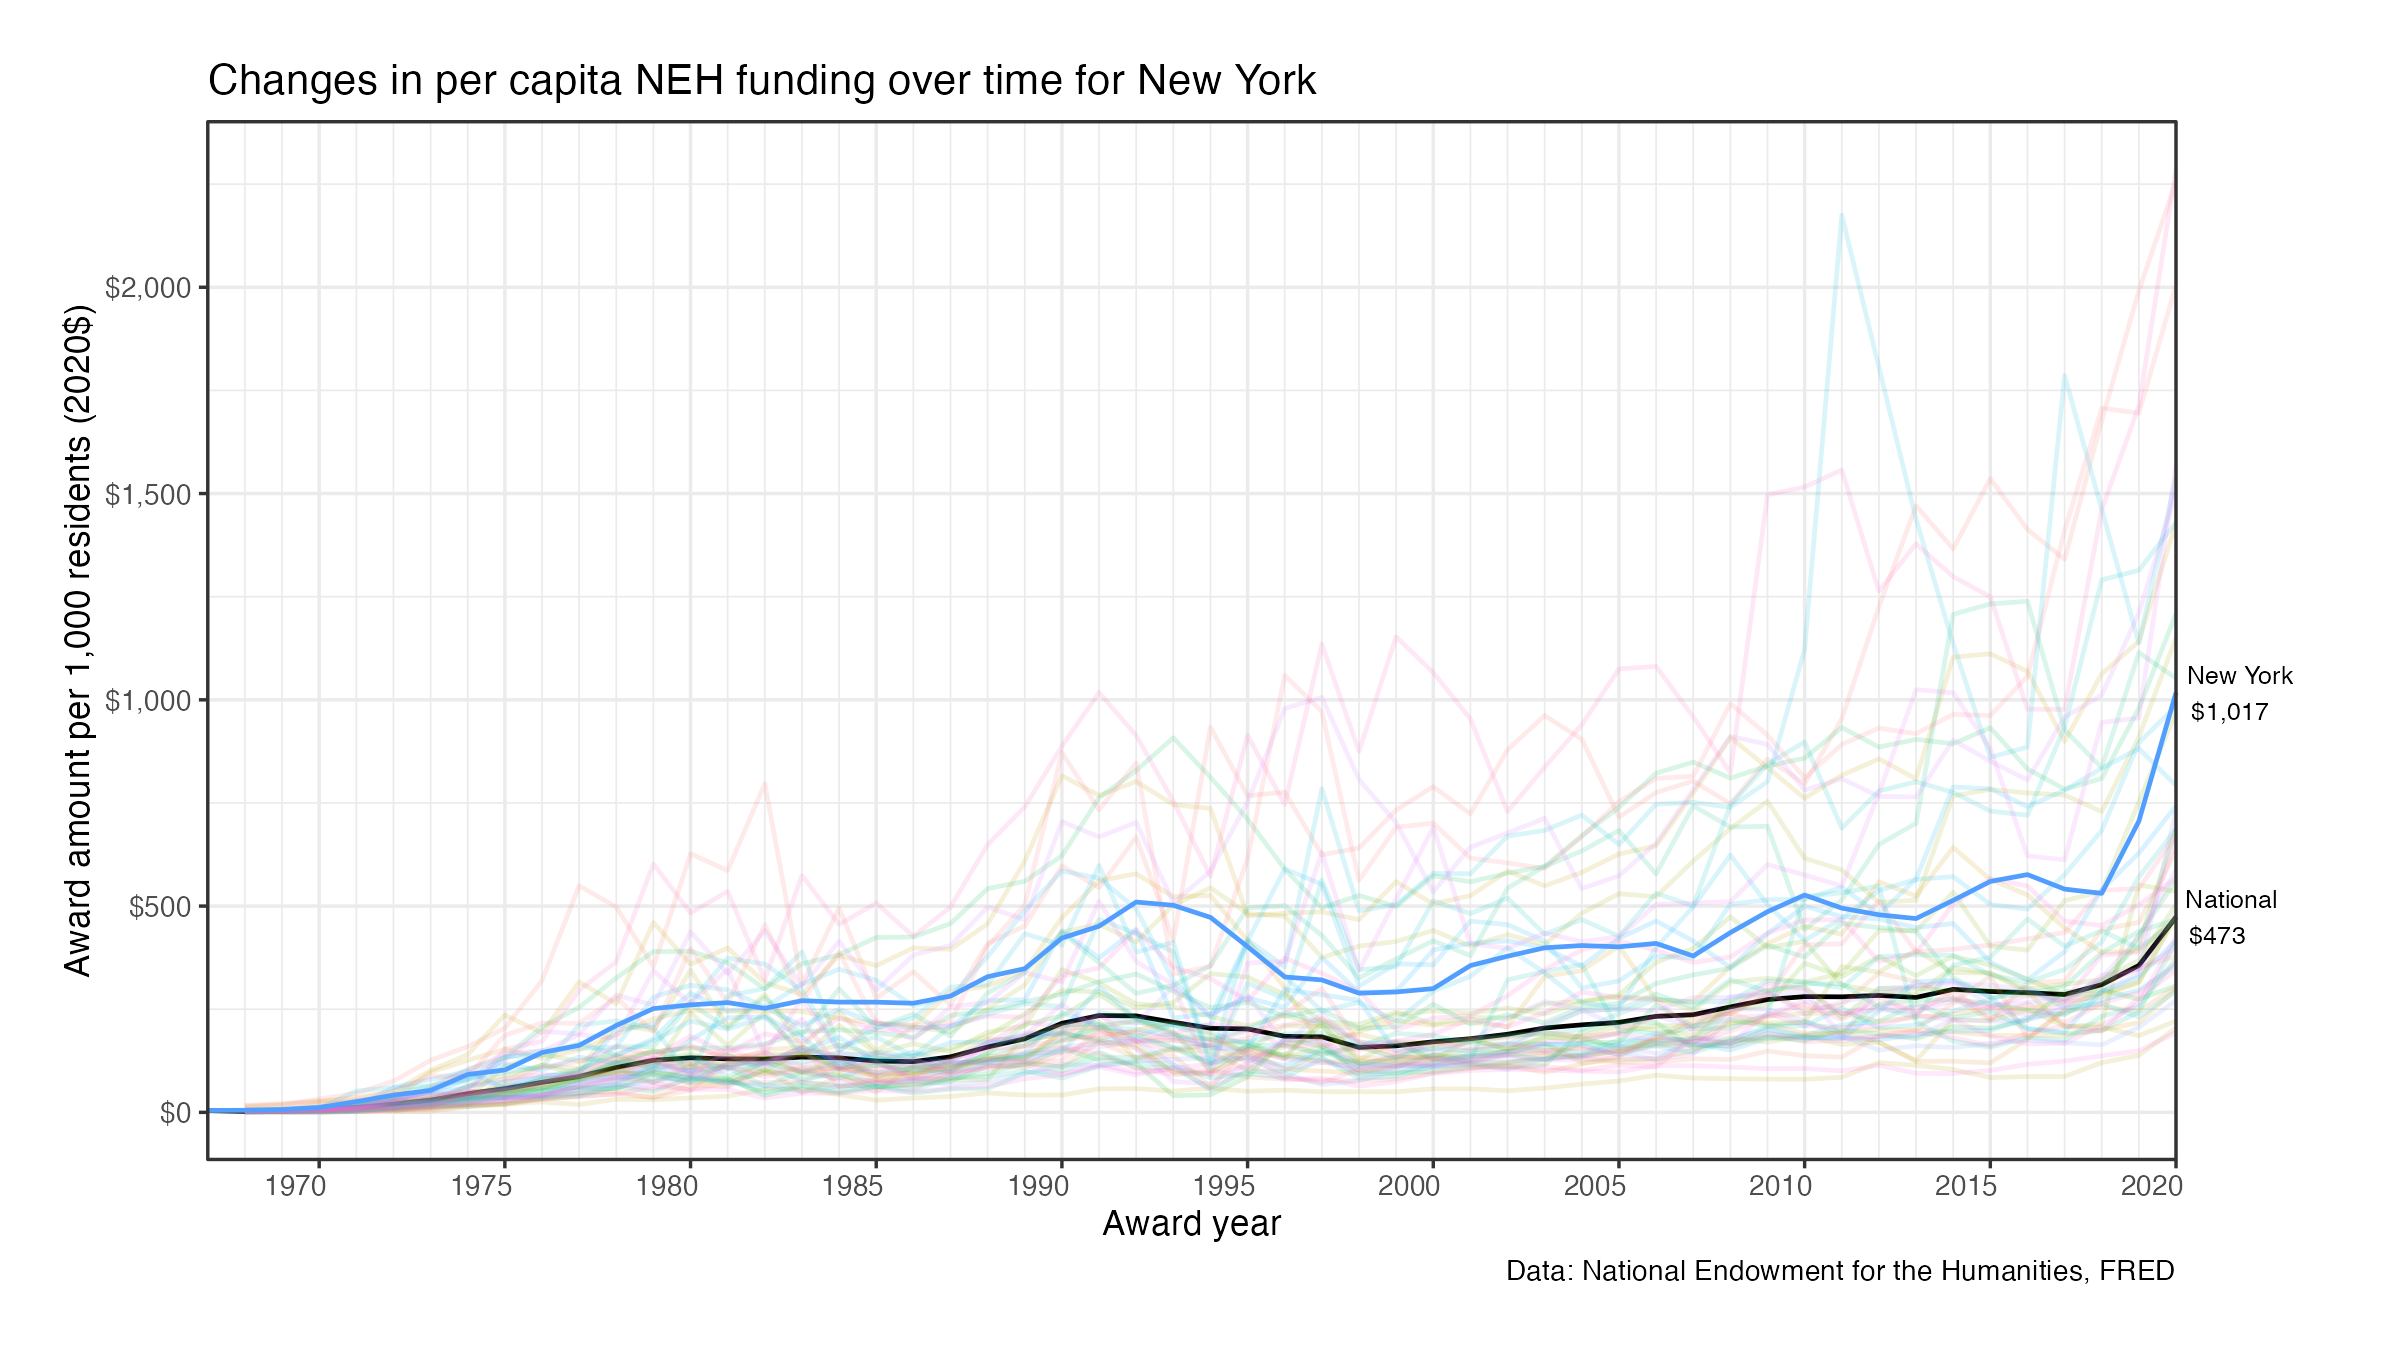
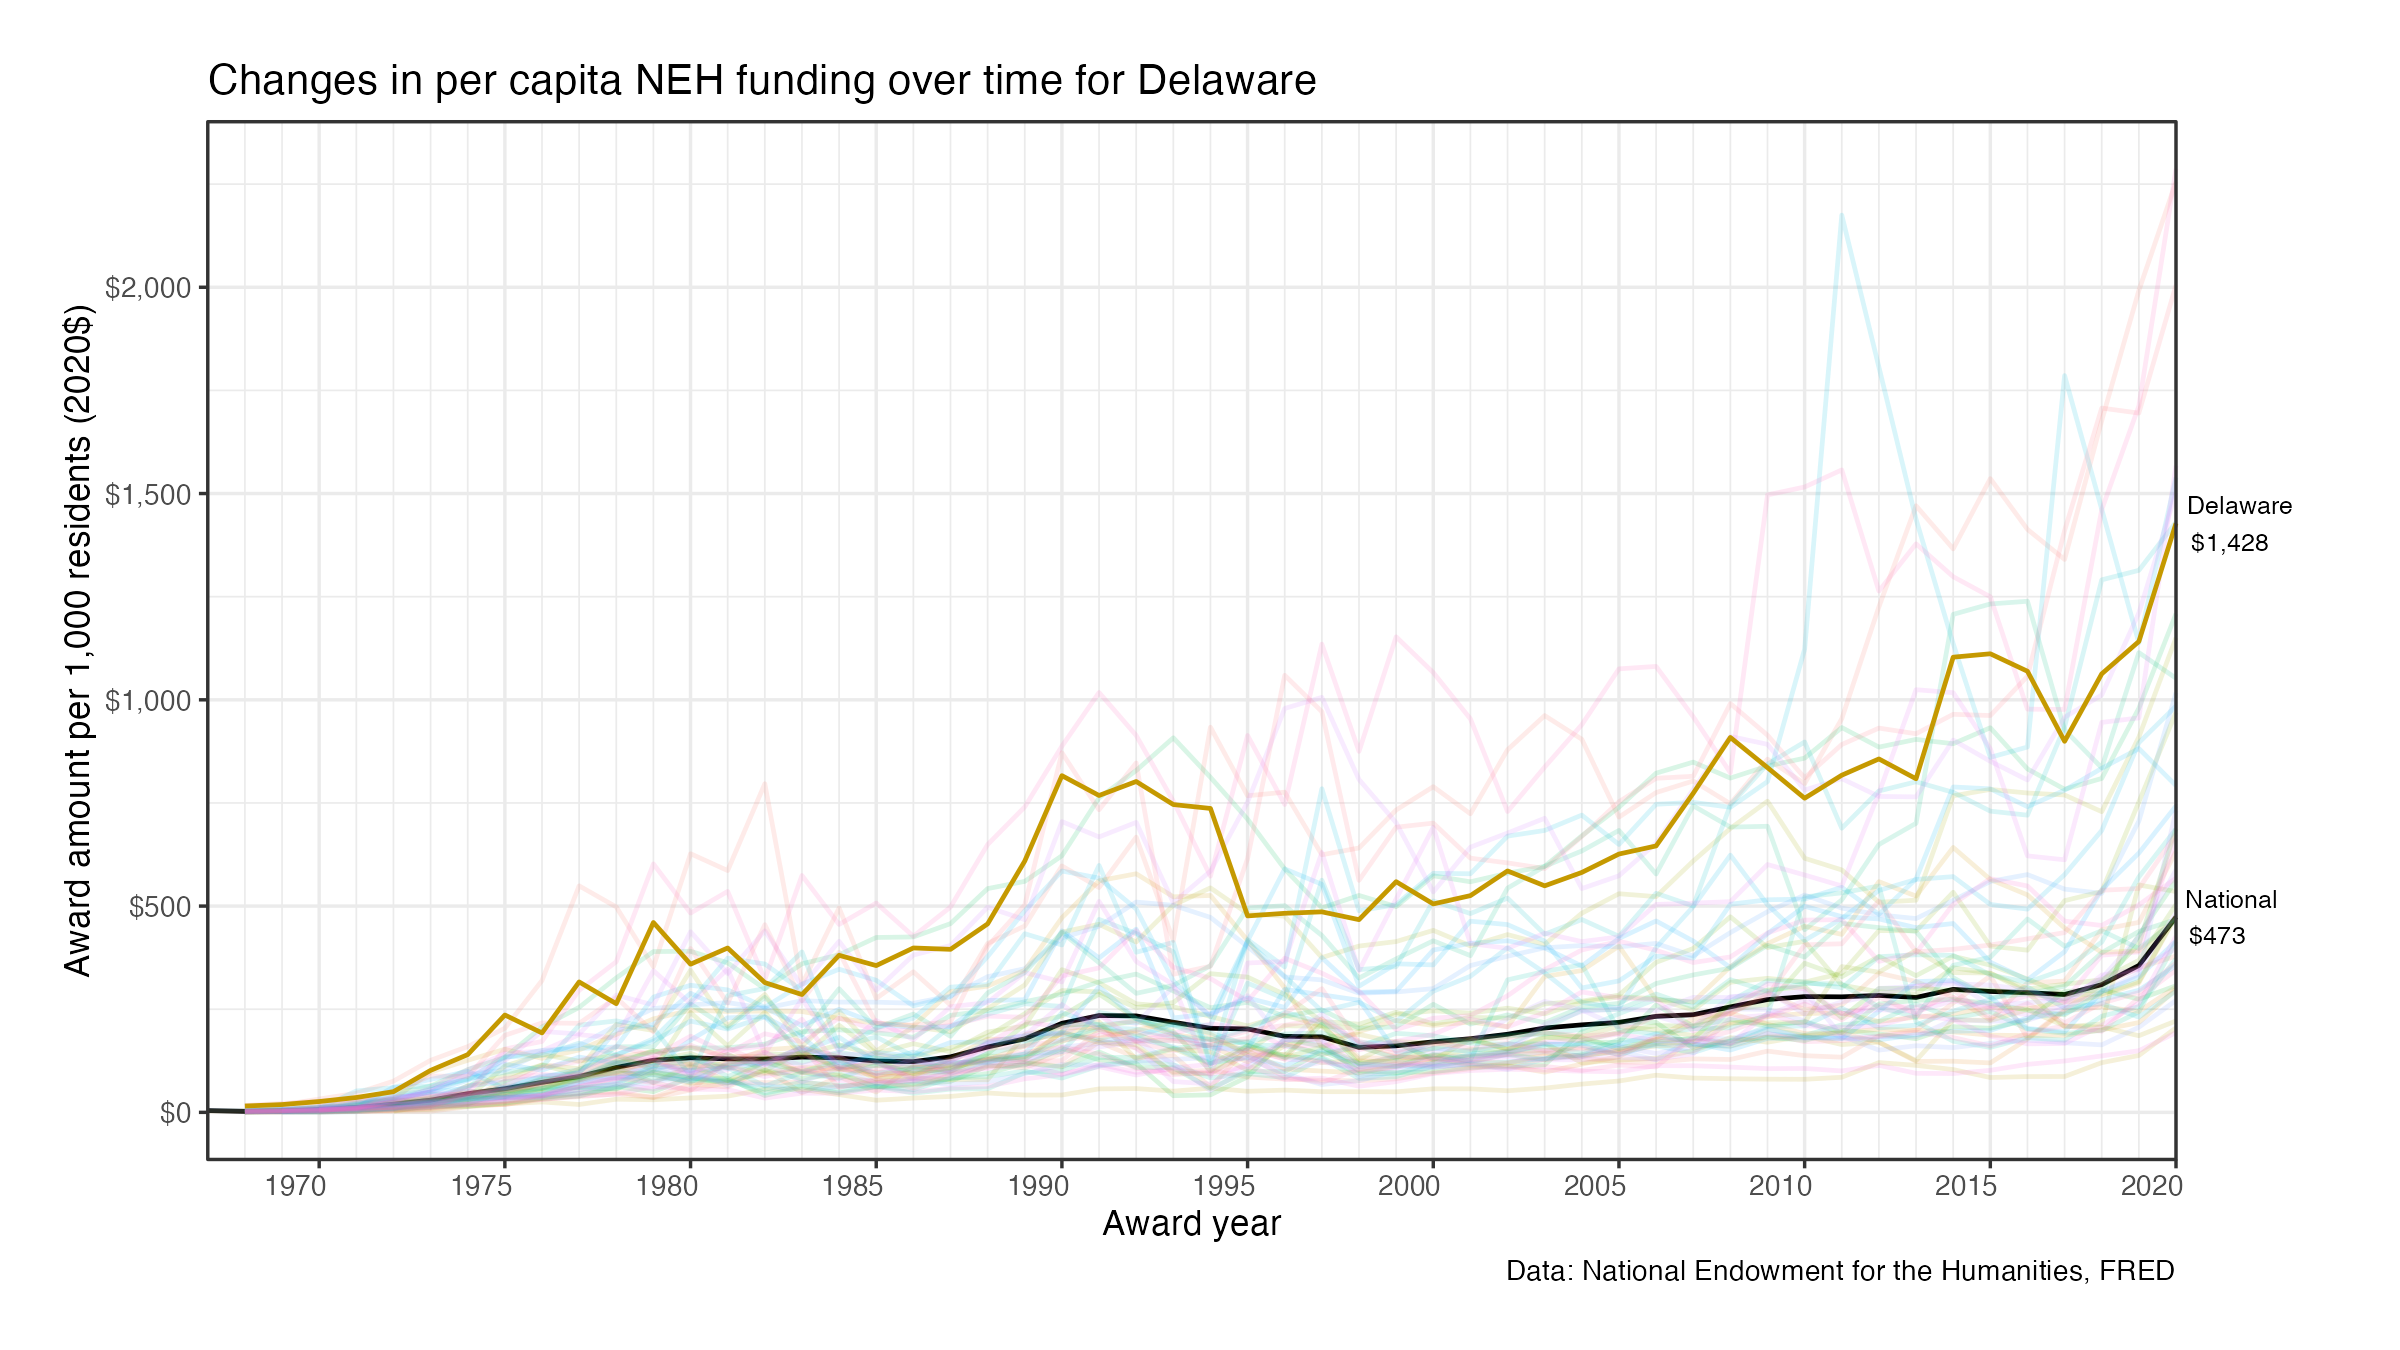
Of interest is how these funds have been awarded across the country. Despite its federal origins and purview, it is worth examining how the distribution of dollars may differ across the states. Below are three examples of differences in funding experienced across the states.
Differences across the states
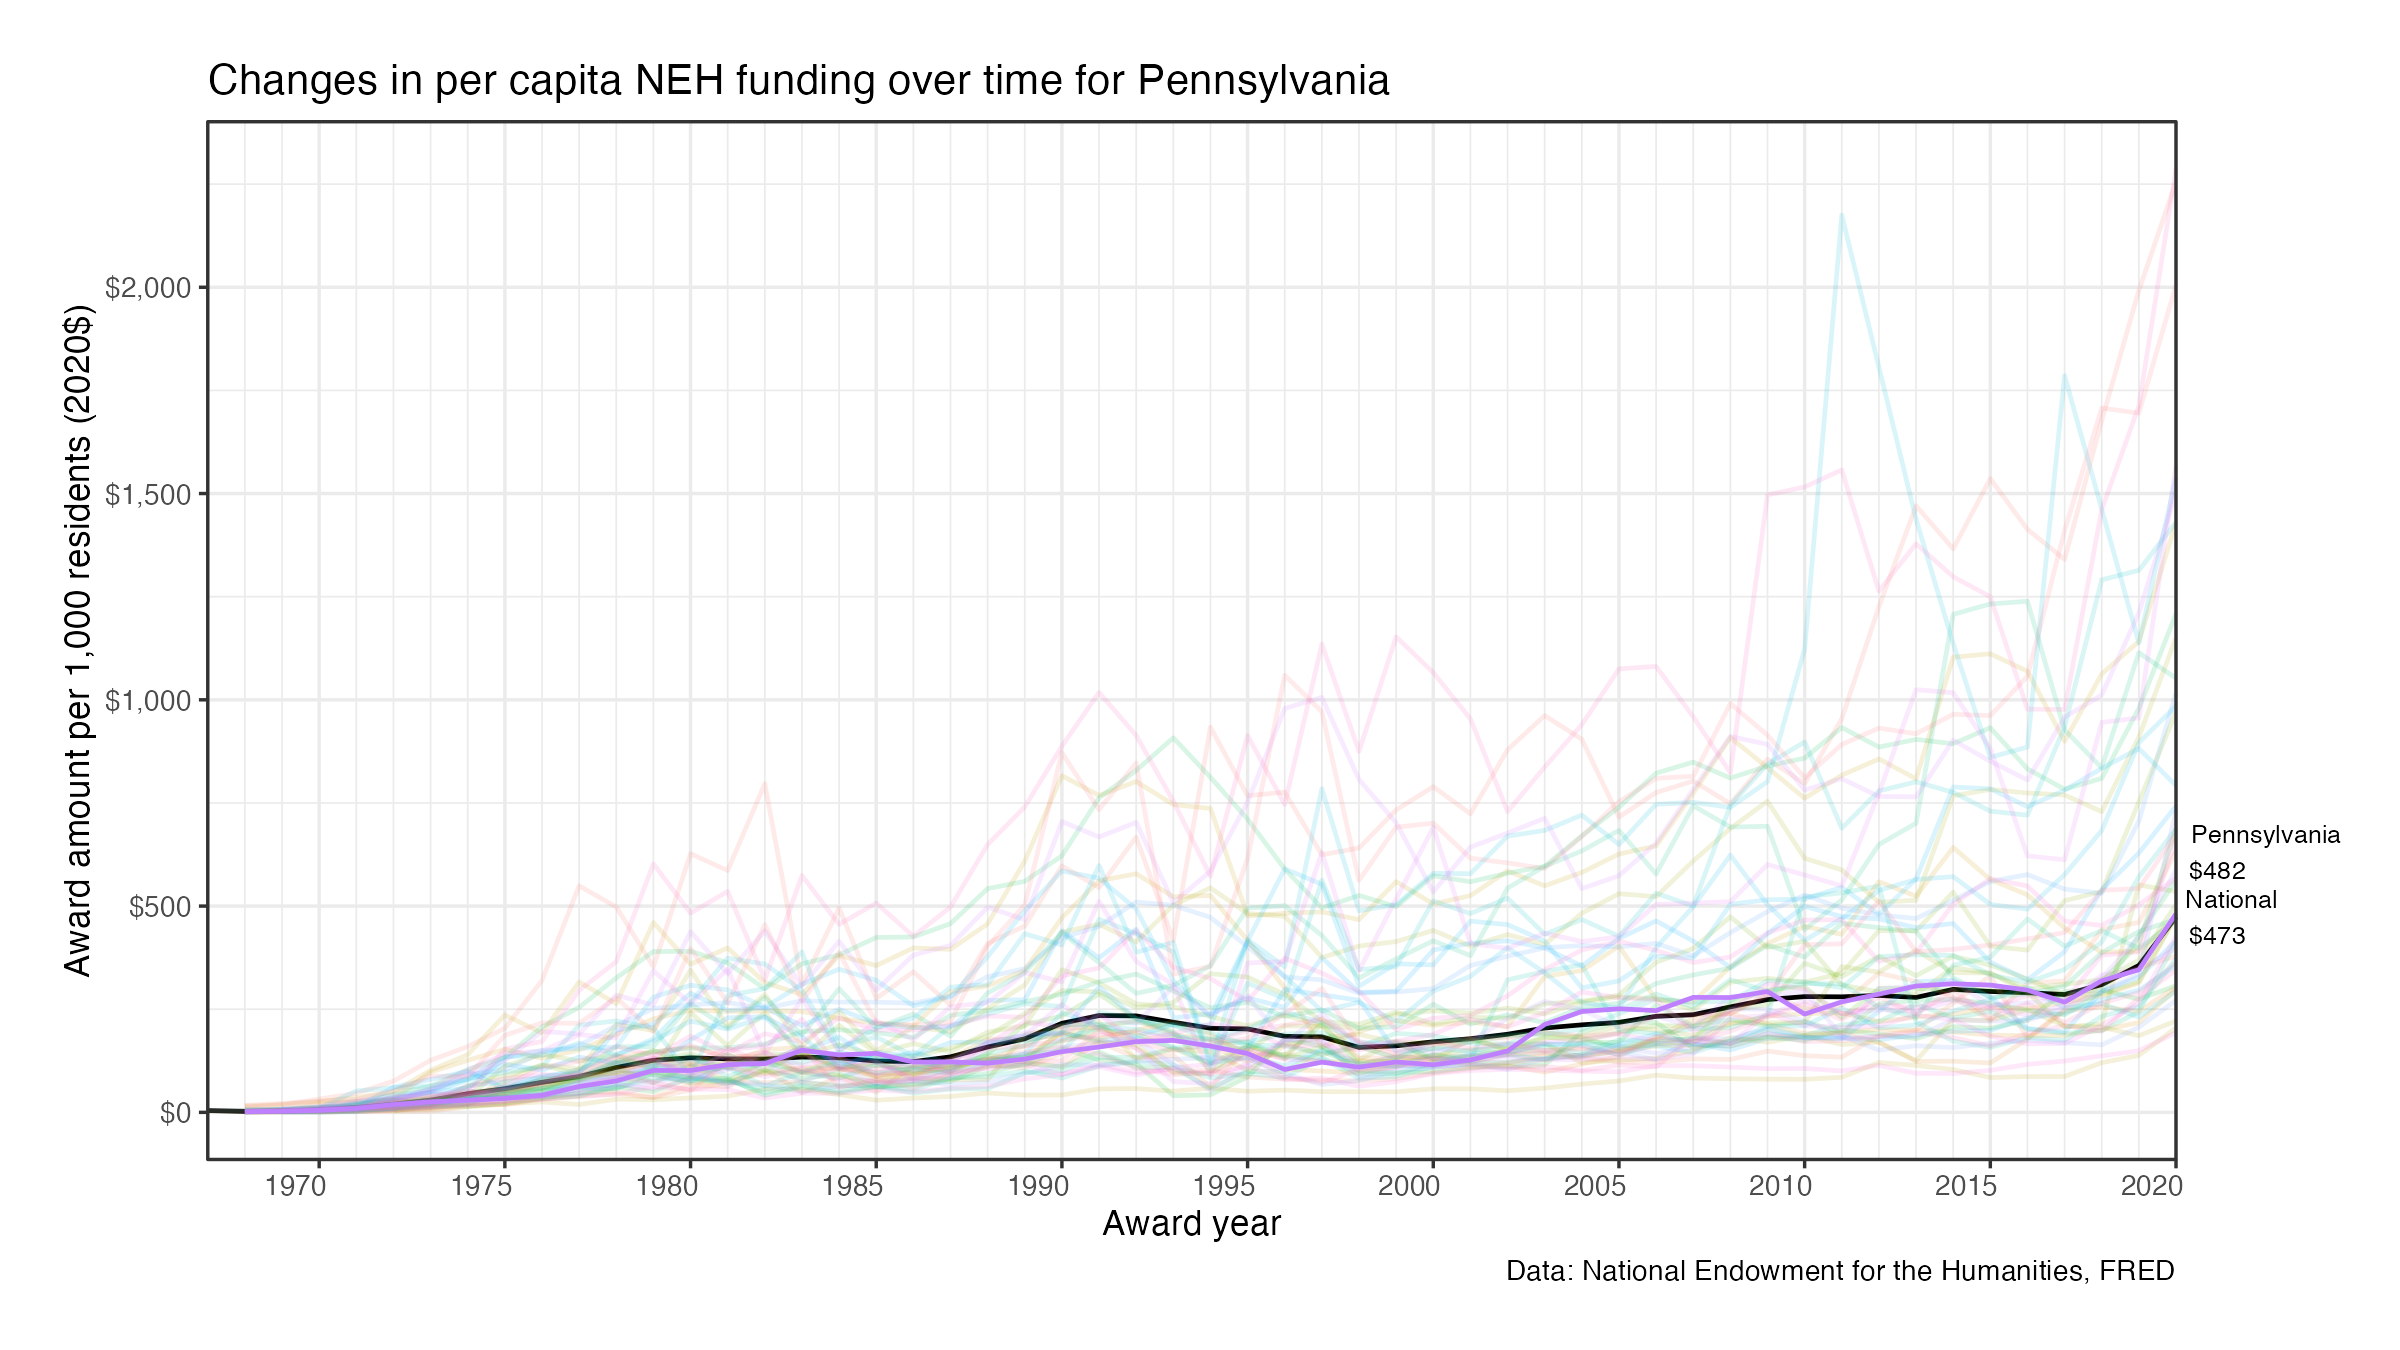
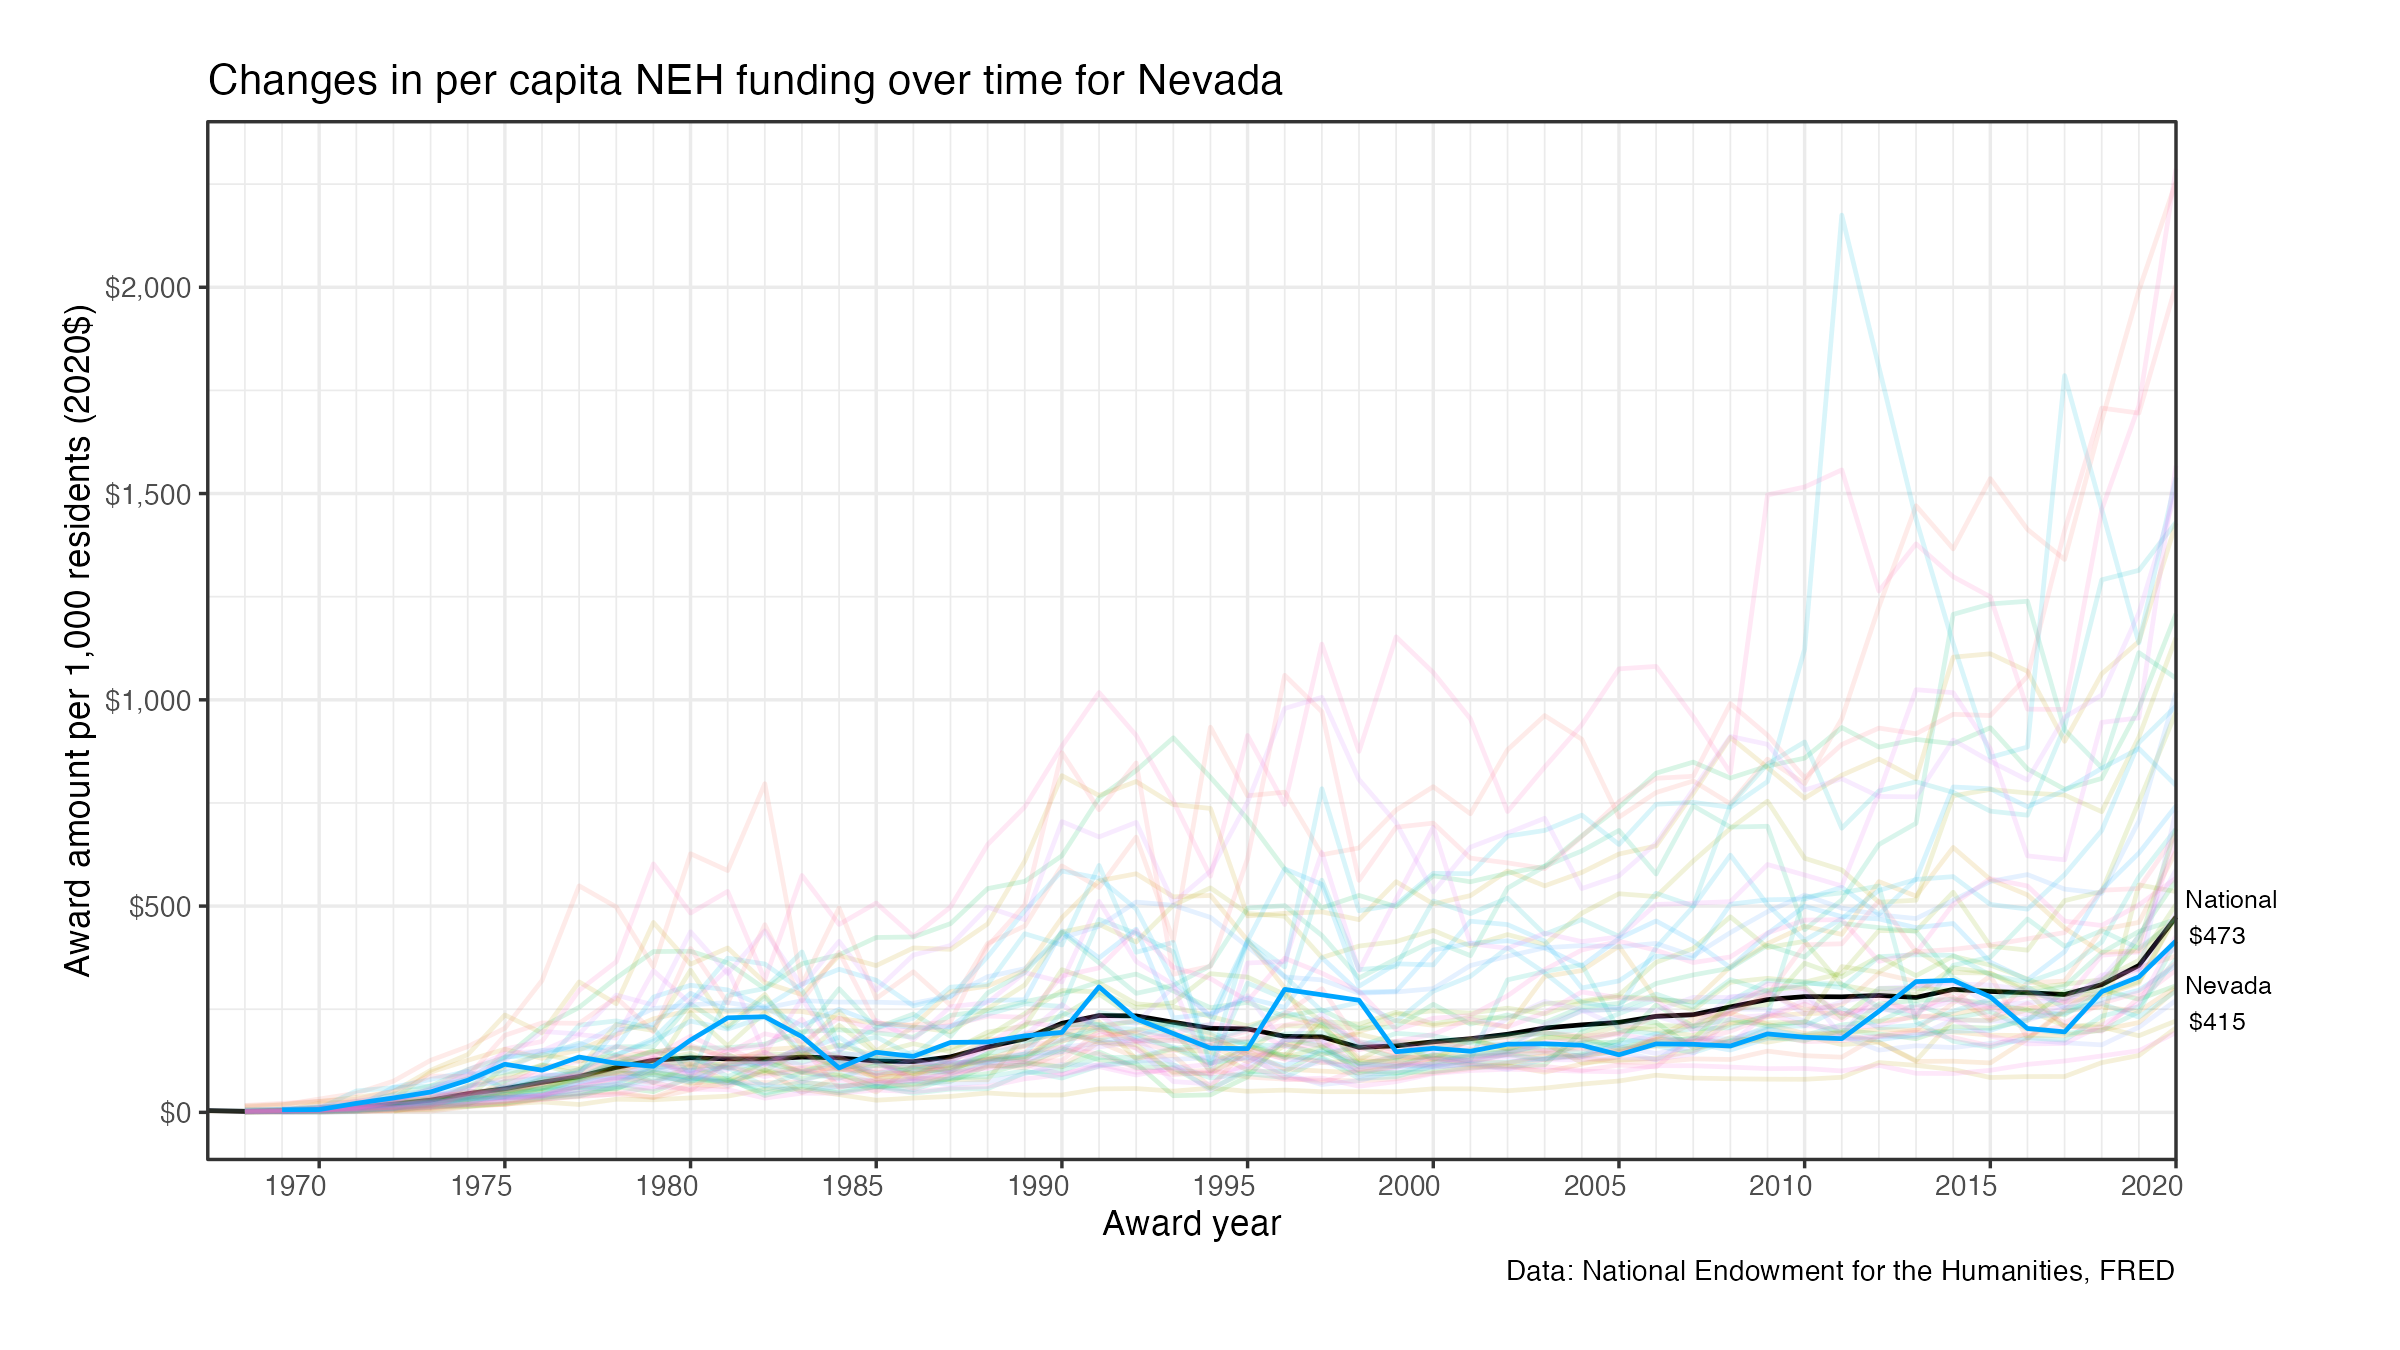
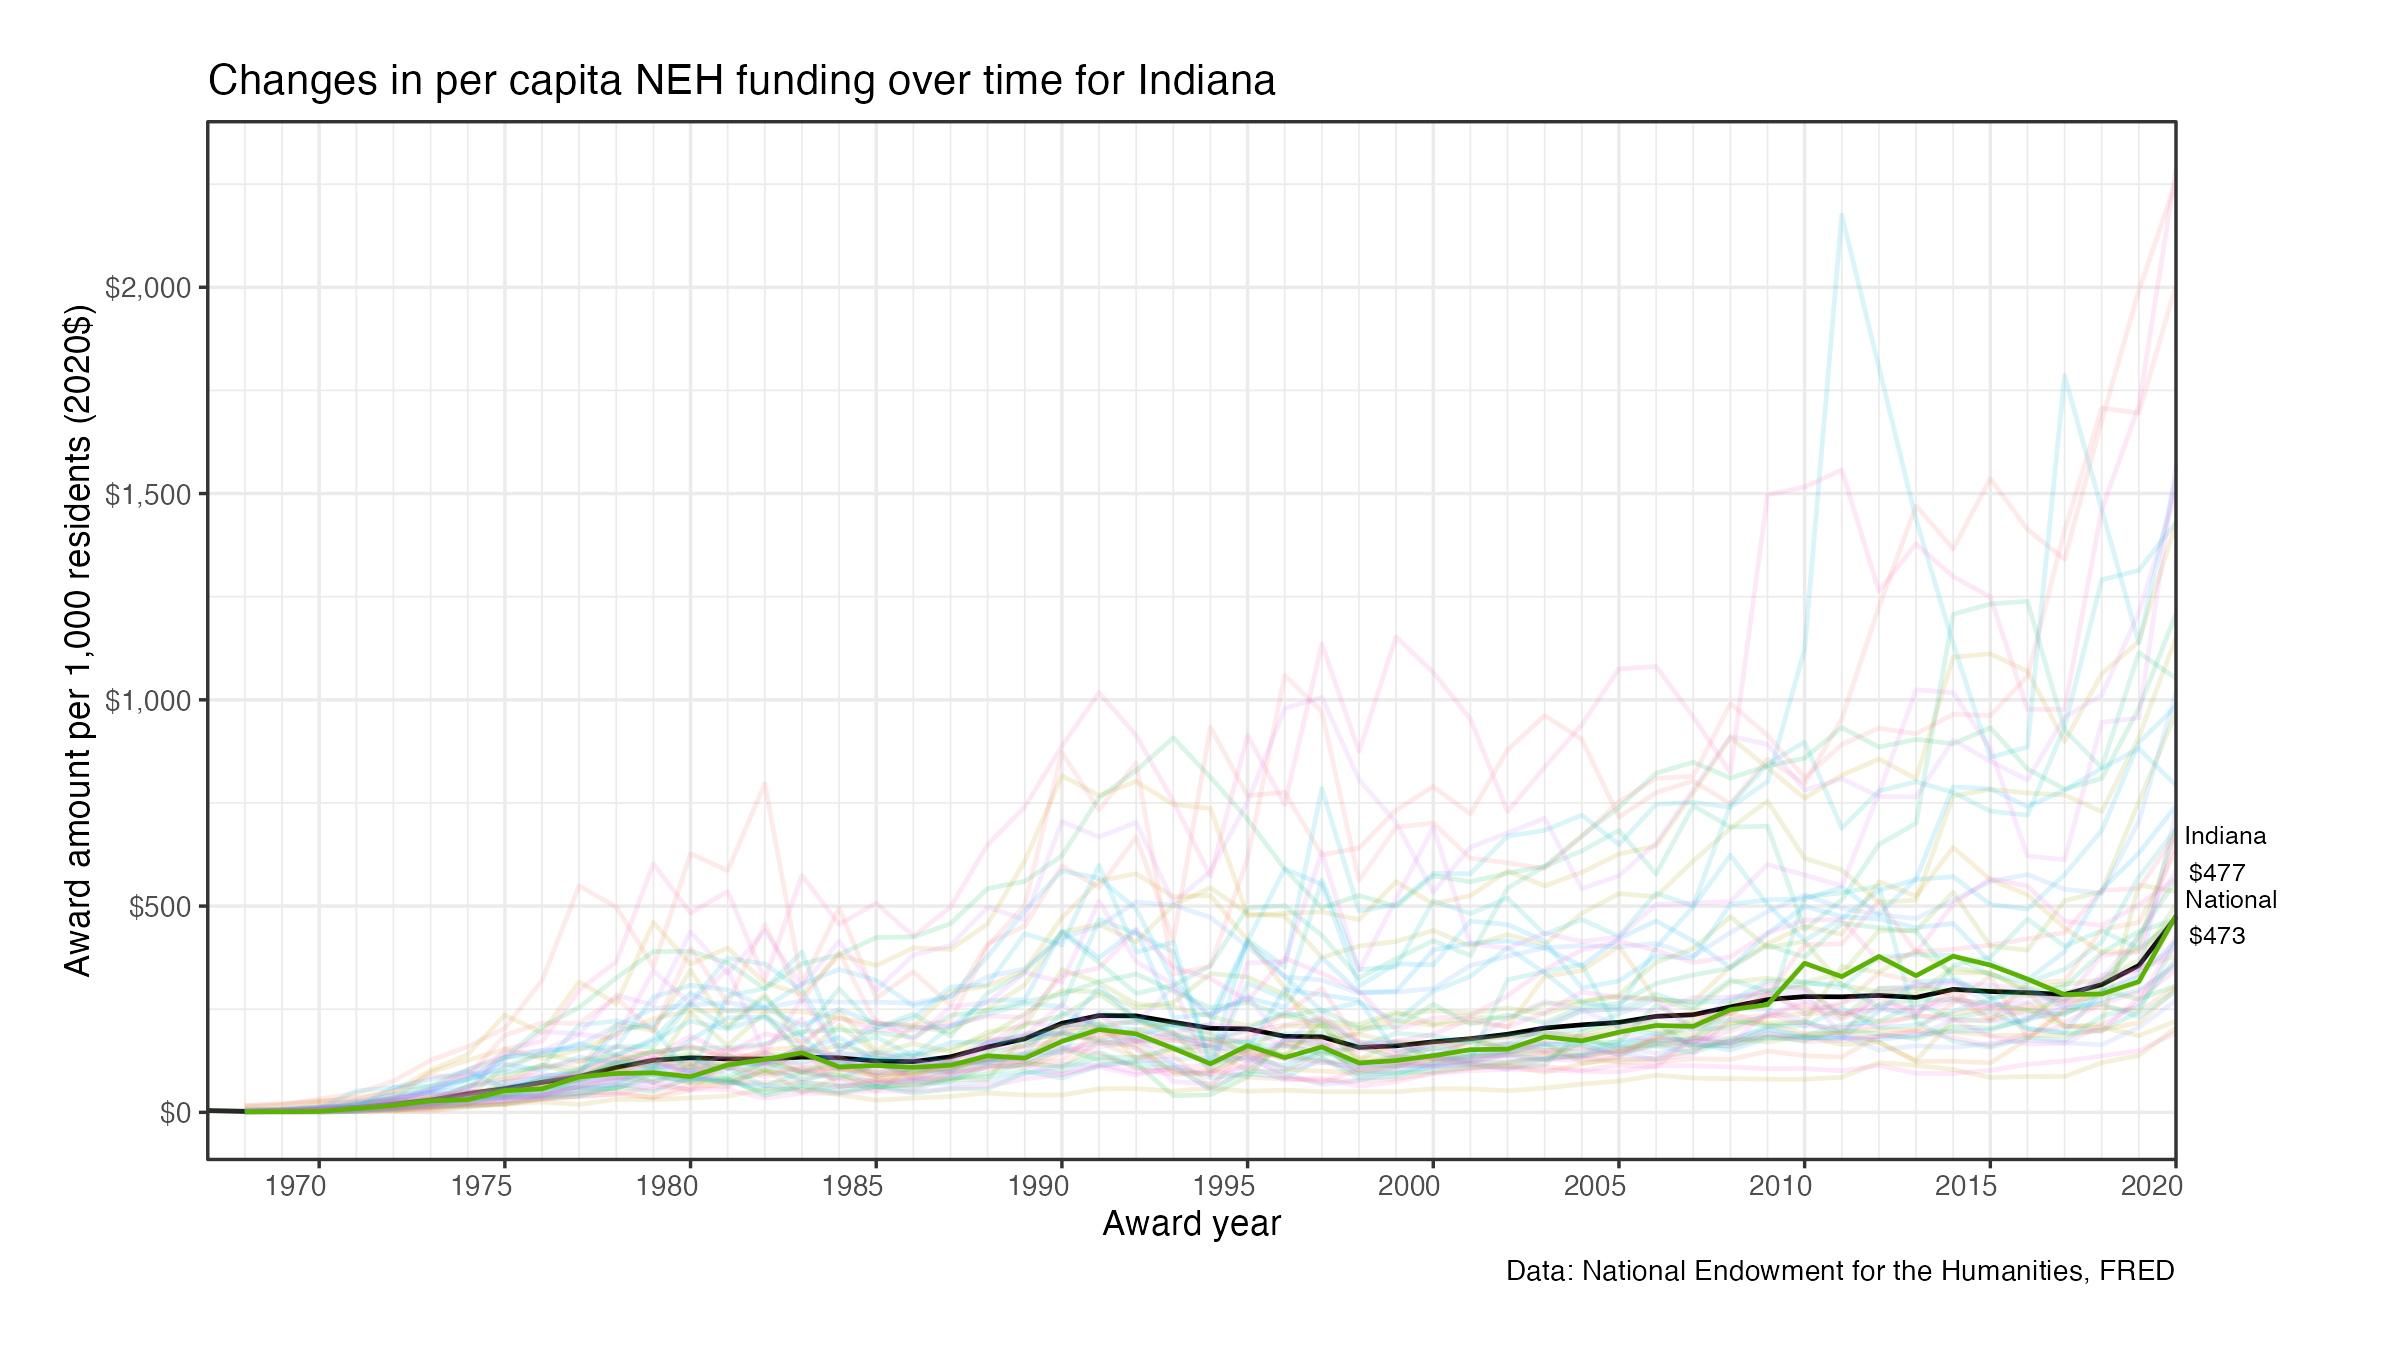
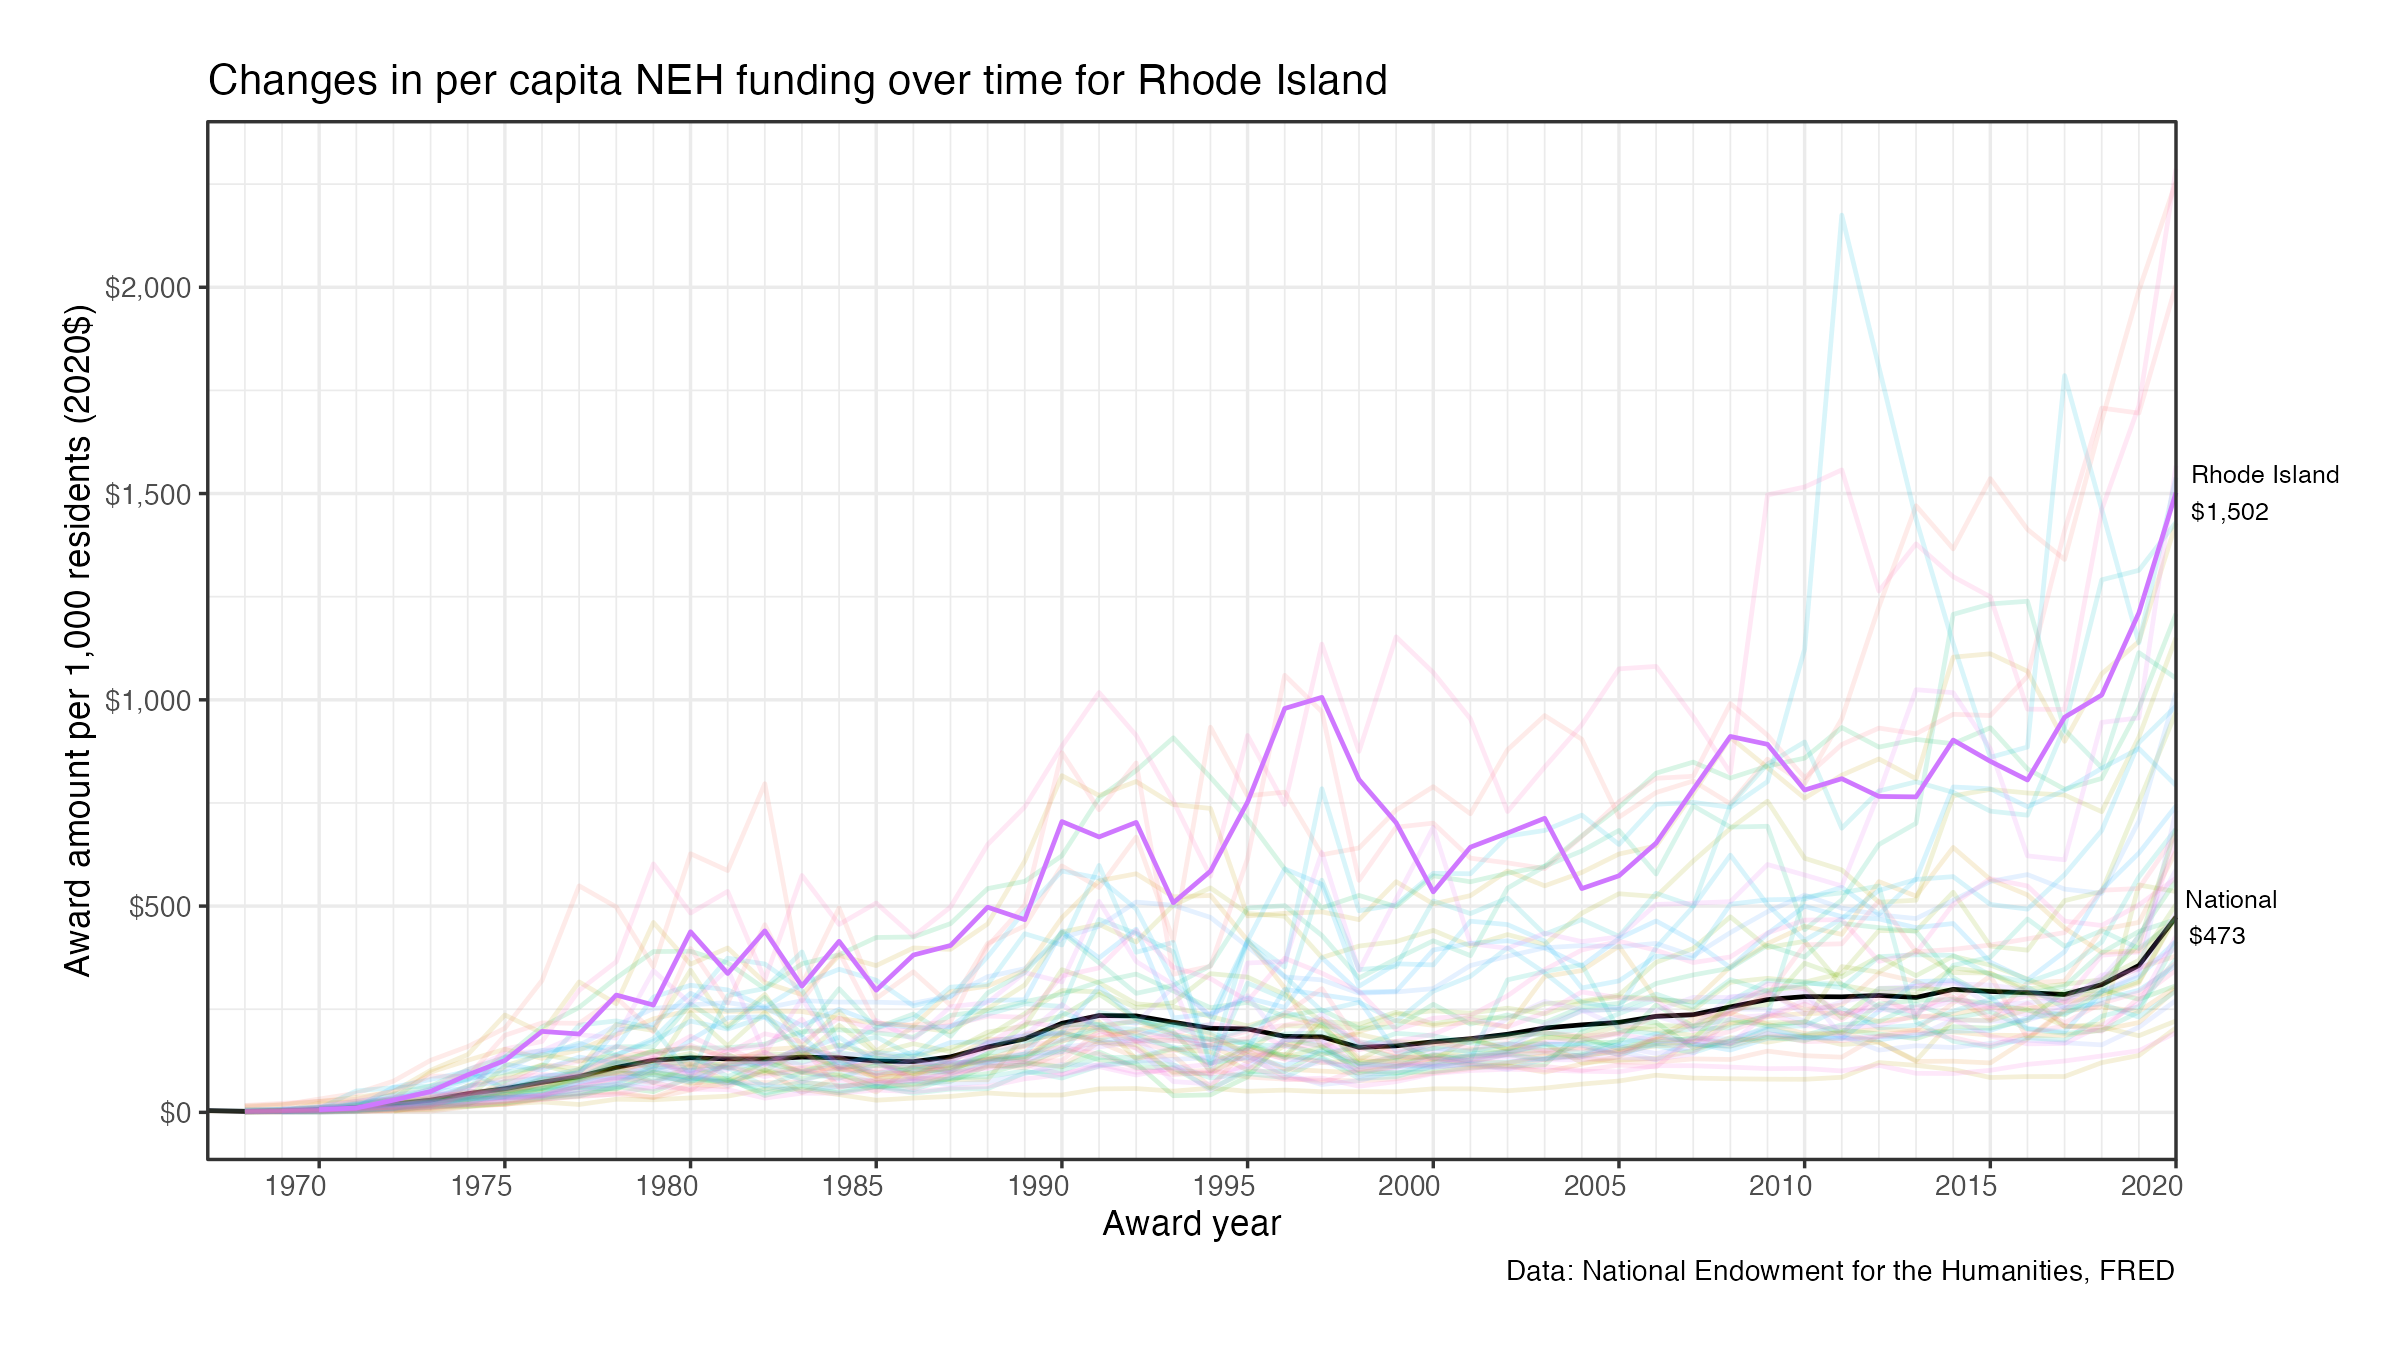
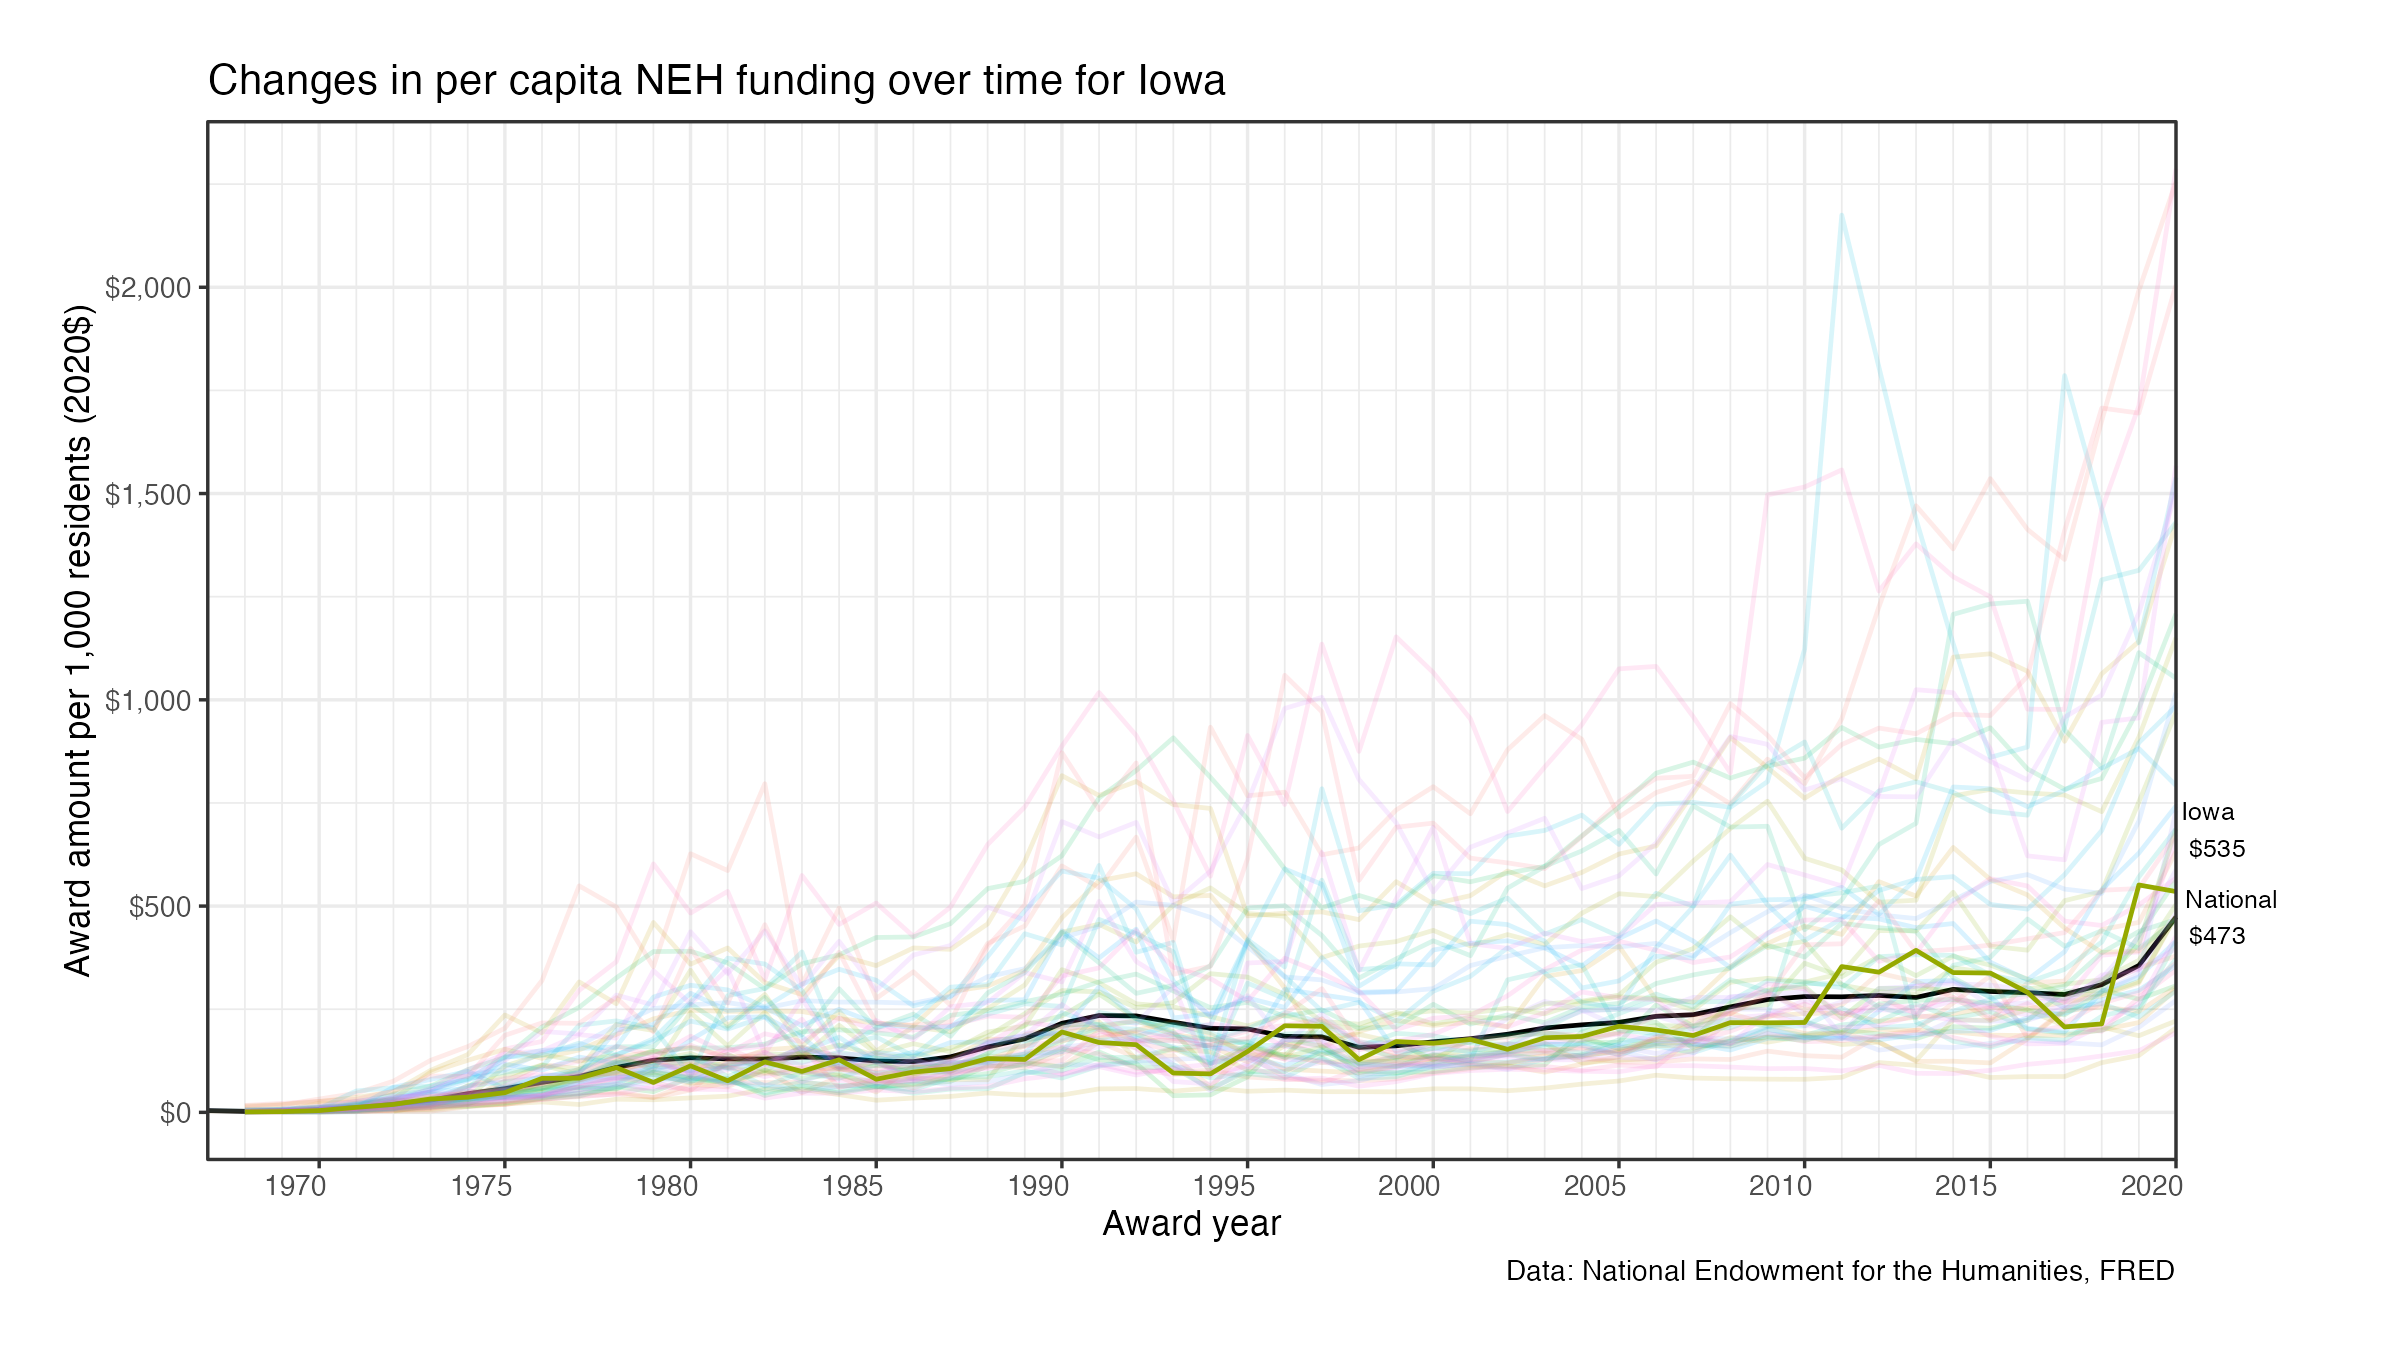
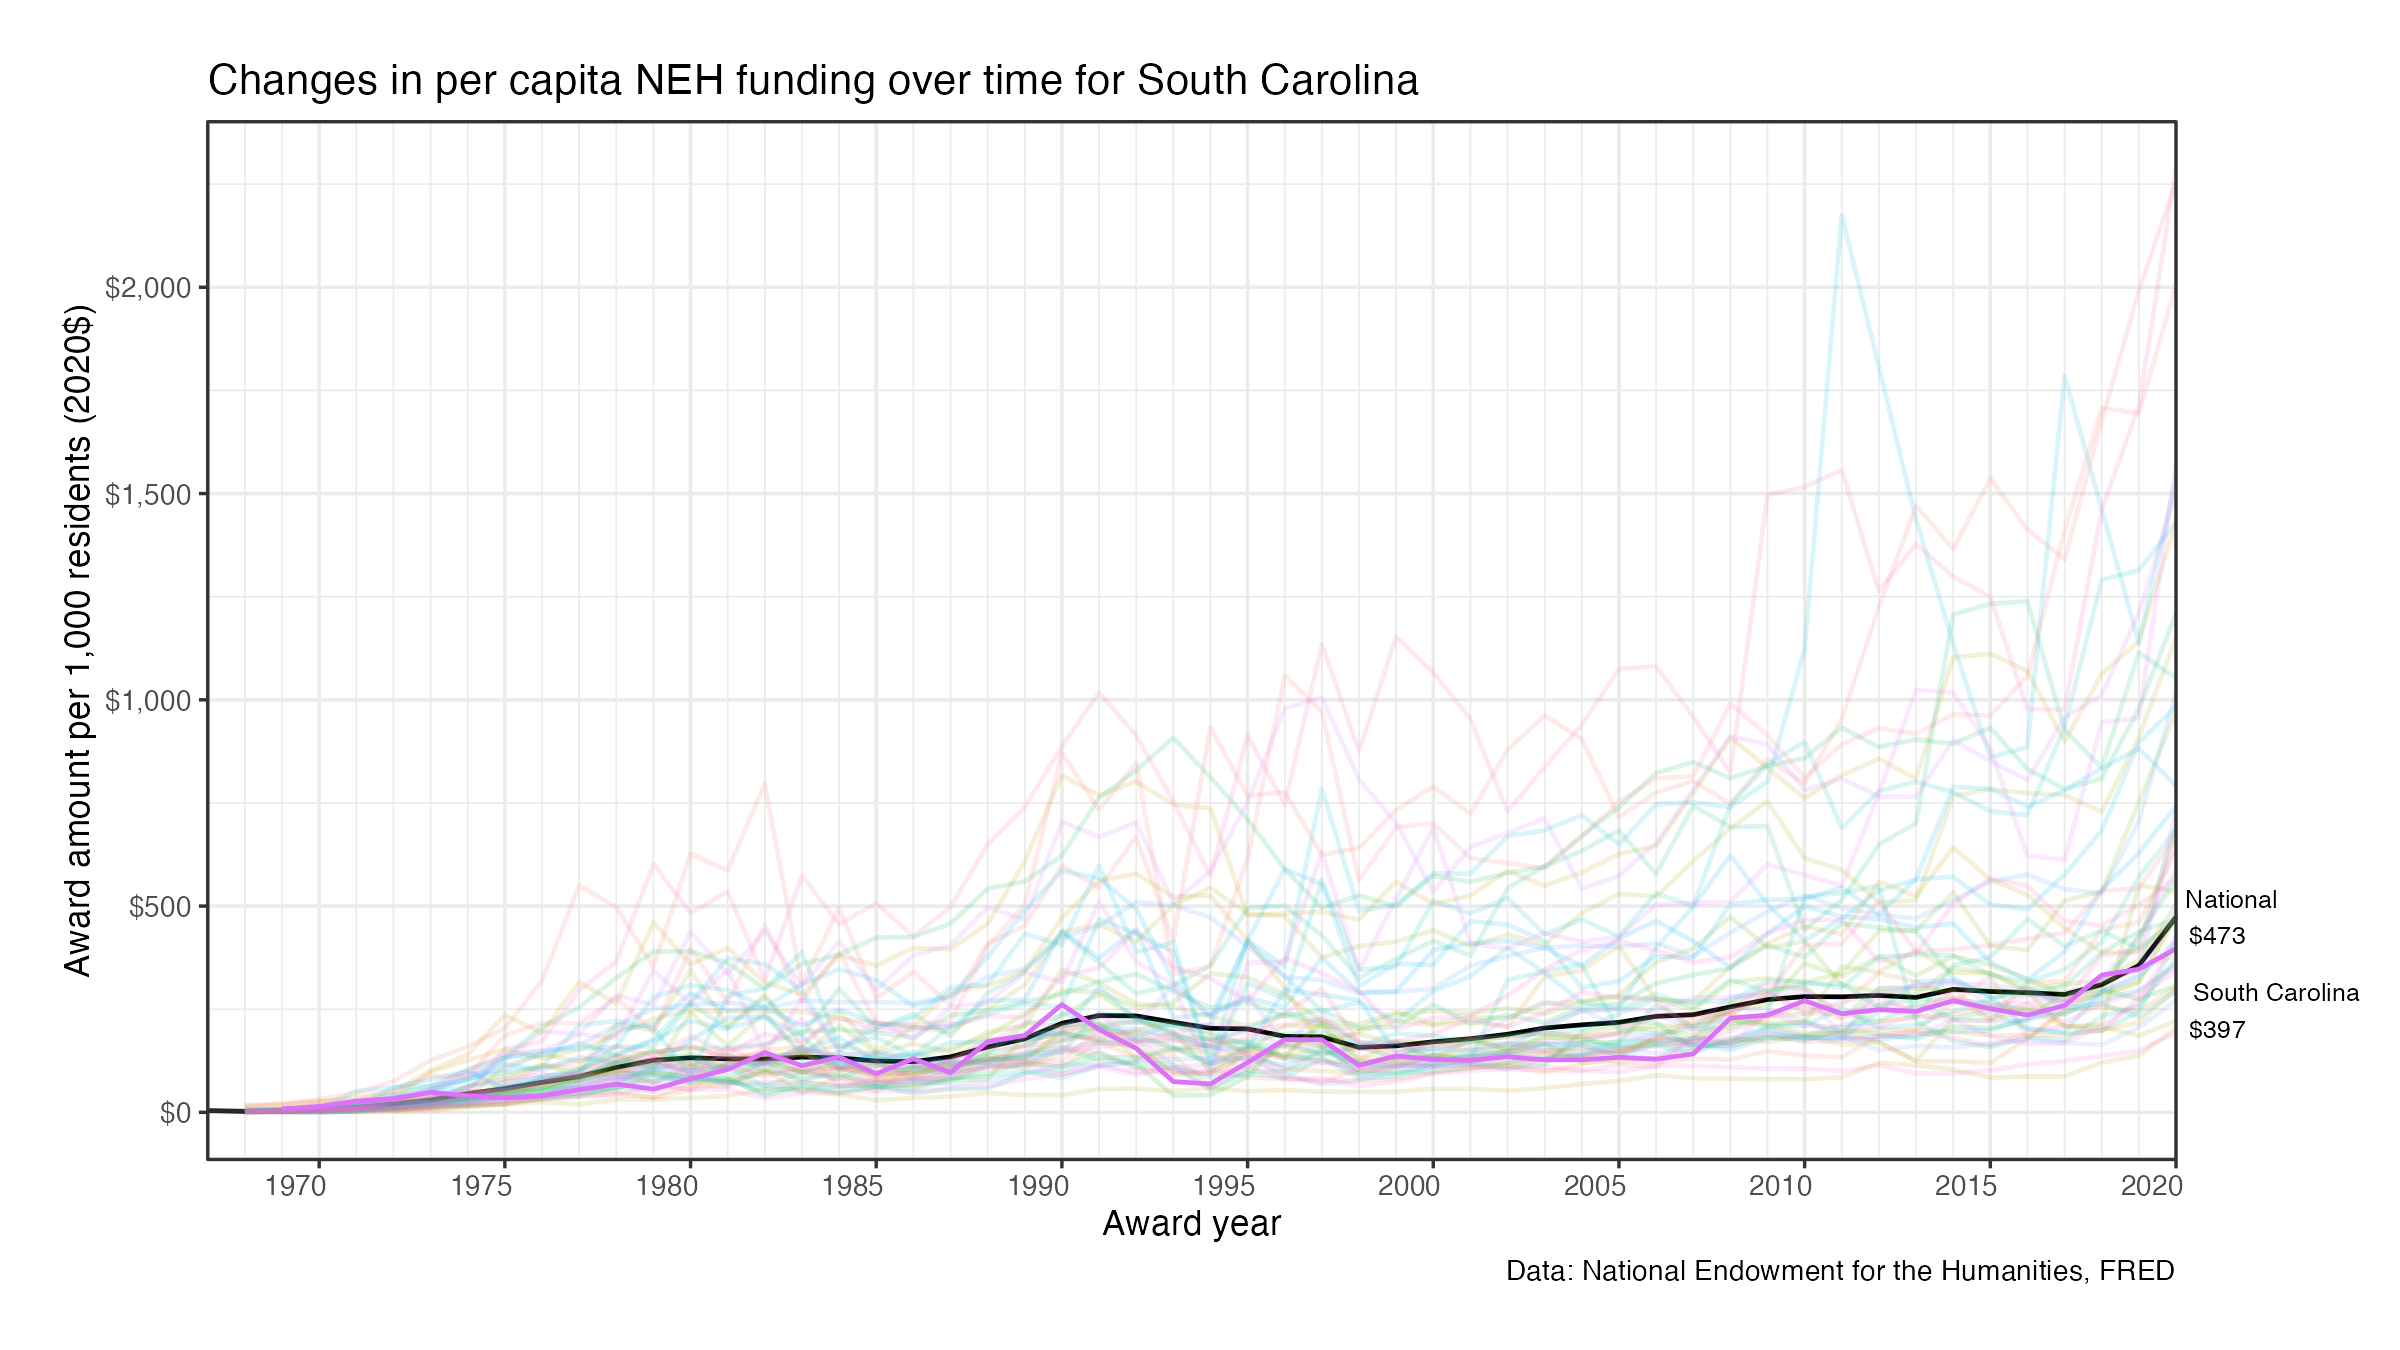
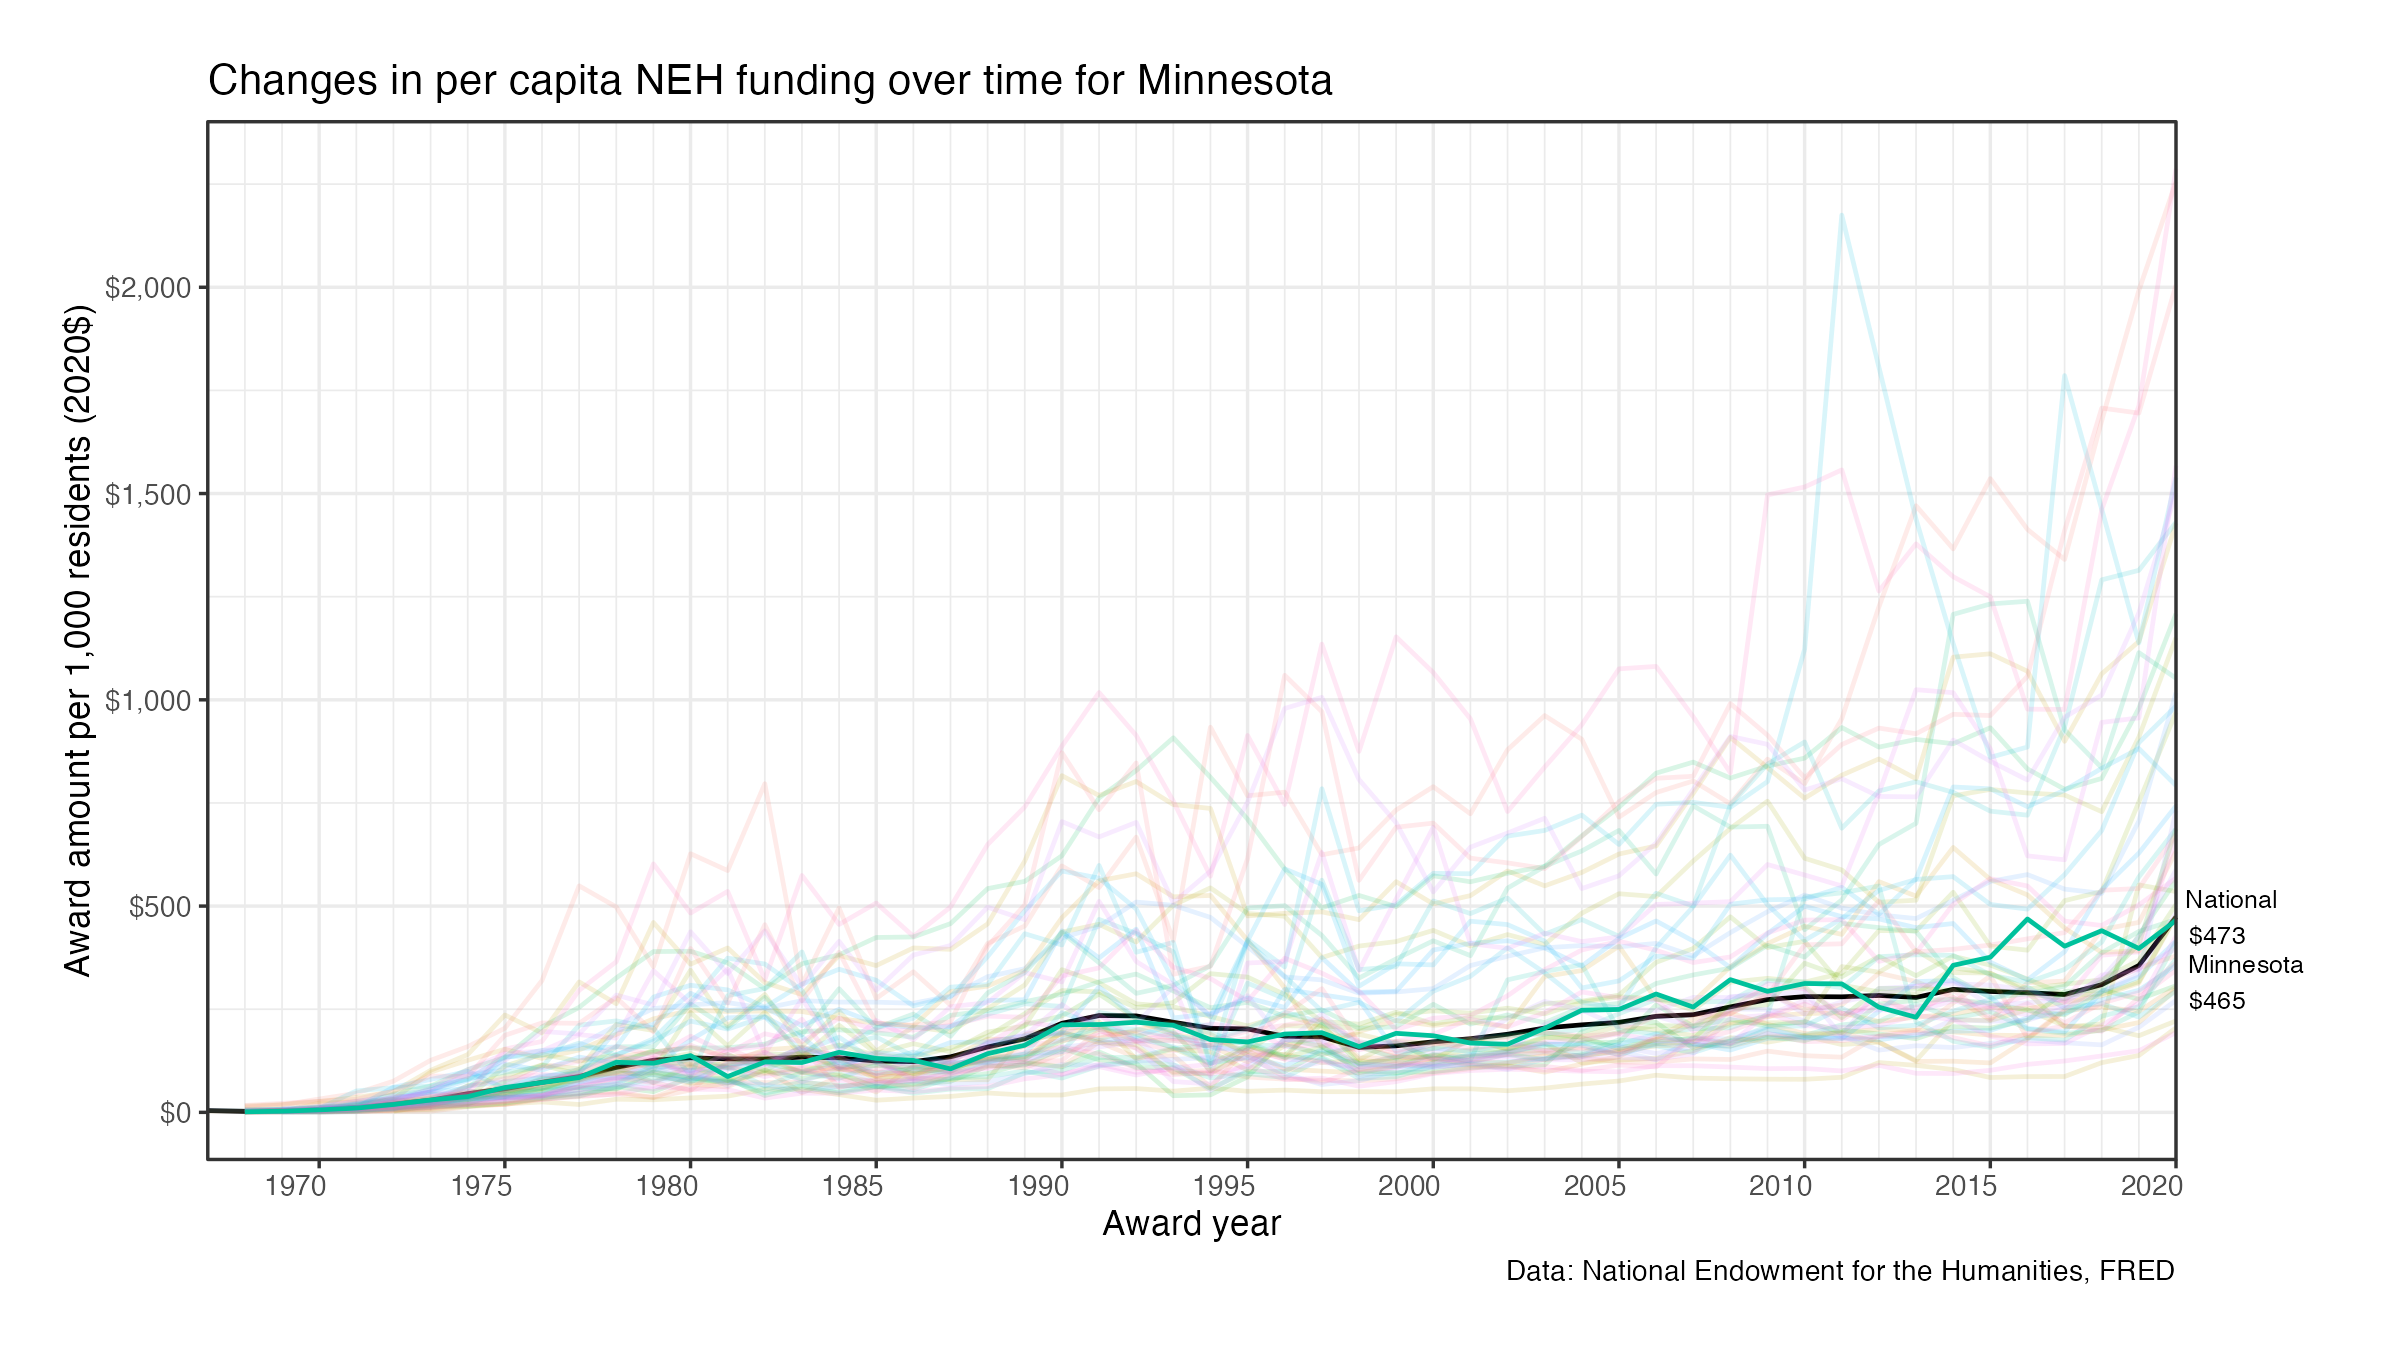
Residents of Pennsylvania are representative of NEH awards in that their funding levels (purple line) have generally tracked the national trend line over time. In the fiscal year 2020, approximately $482 were spent for every 1,000 residents of Pennsylvania. Residents of Iowa ($535), Indiana ($477), Minnesota ($473), Oregon ($415), and South Carolina ($397) have similarly seen per capita award amounts that have tracked national trends.
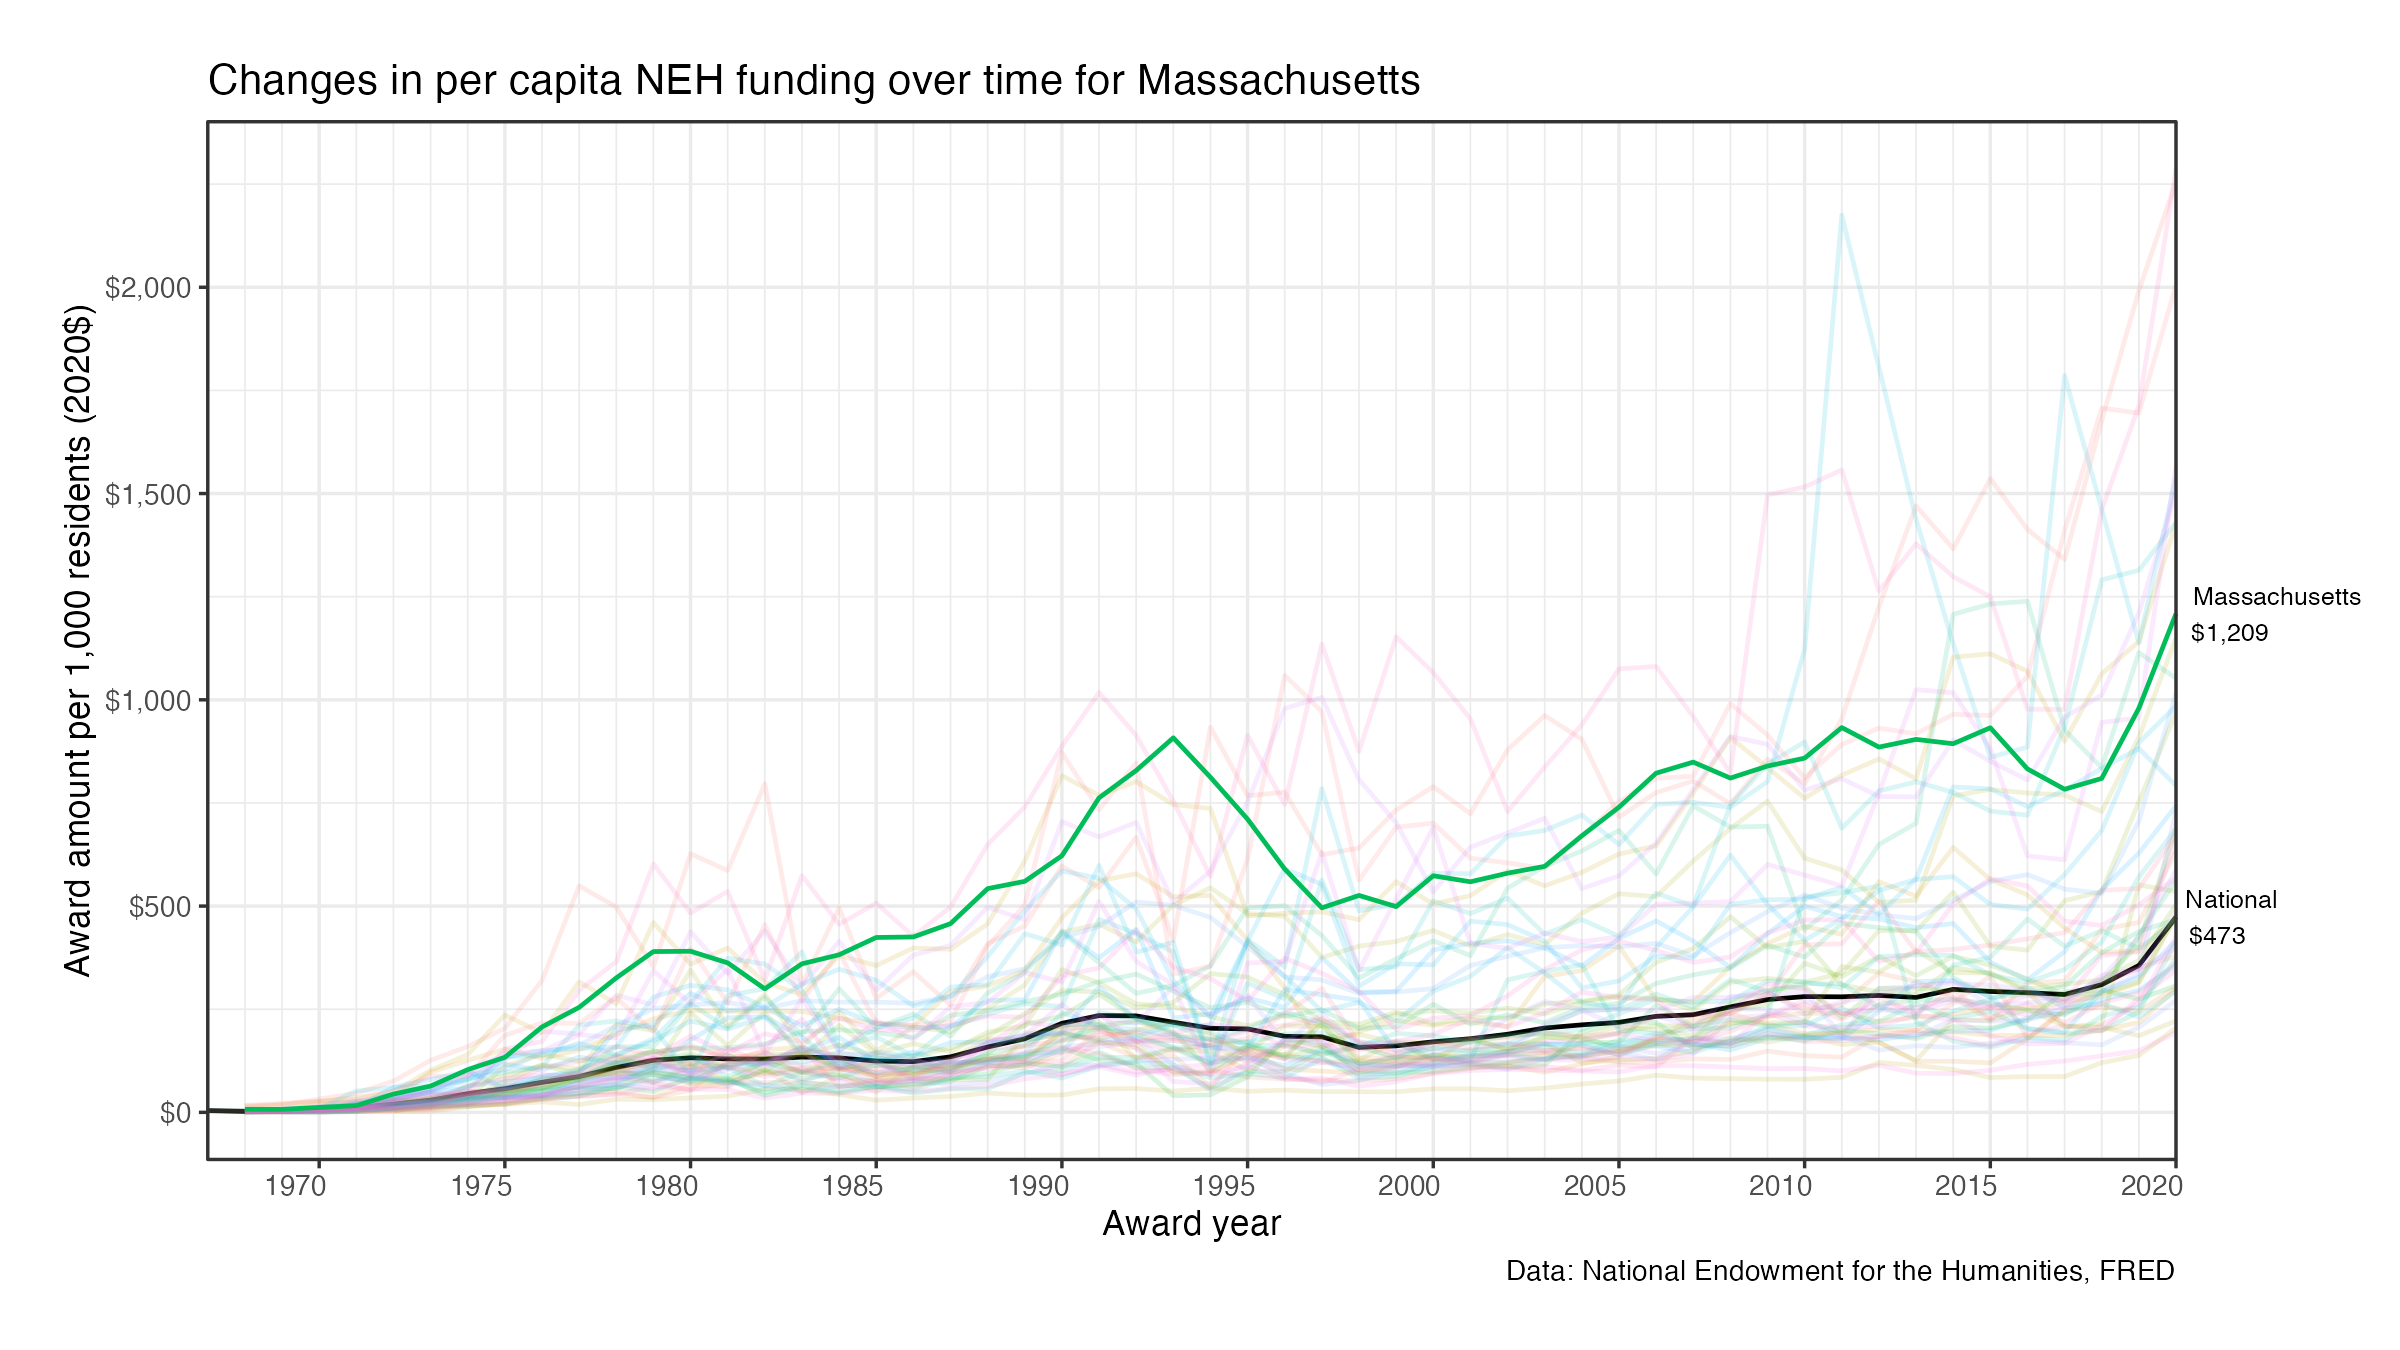
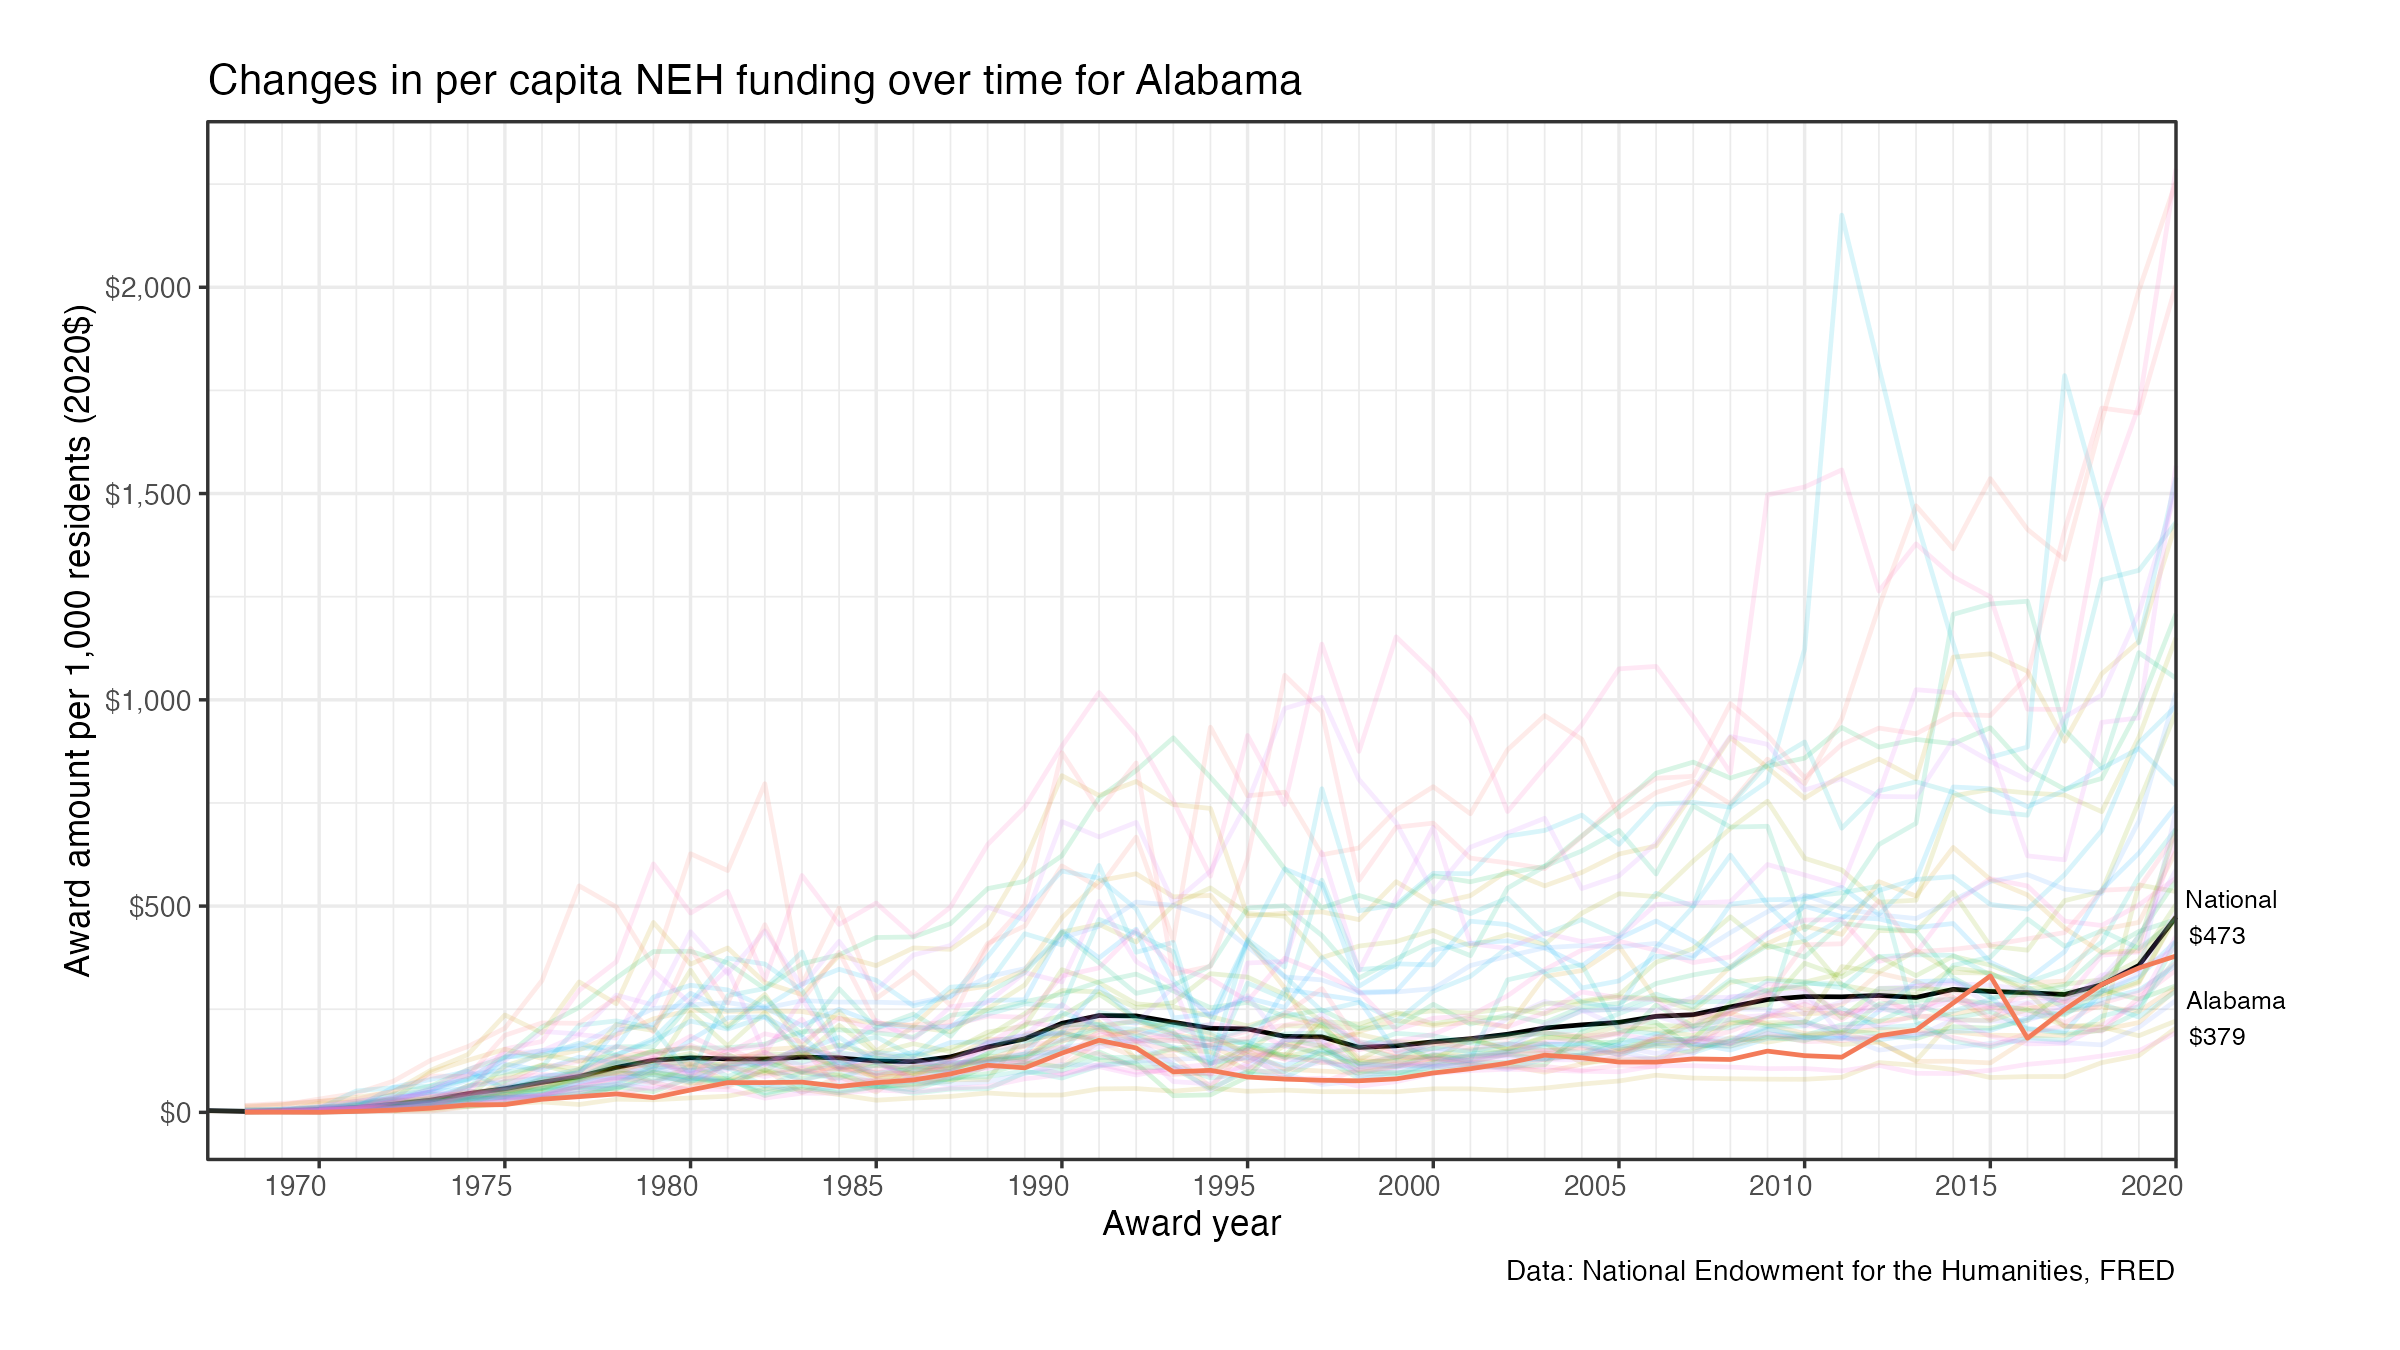
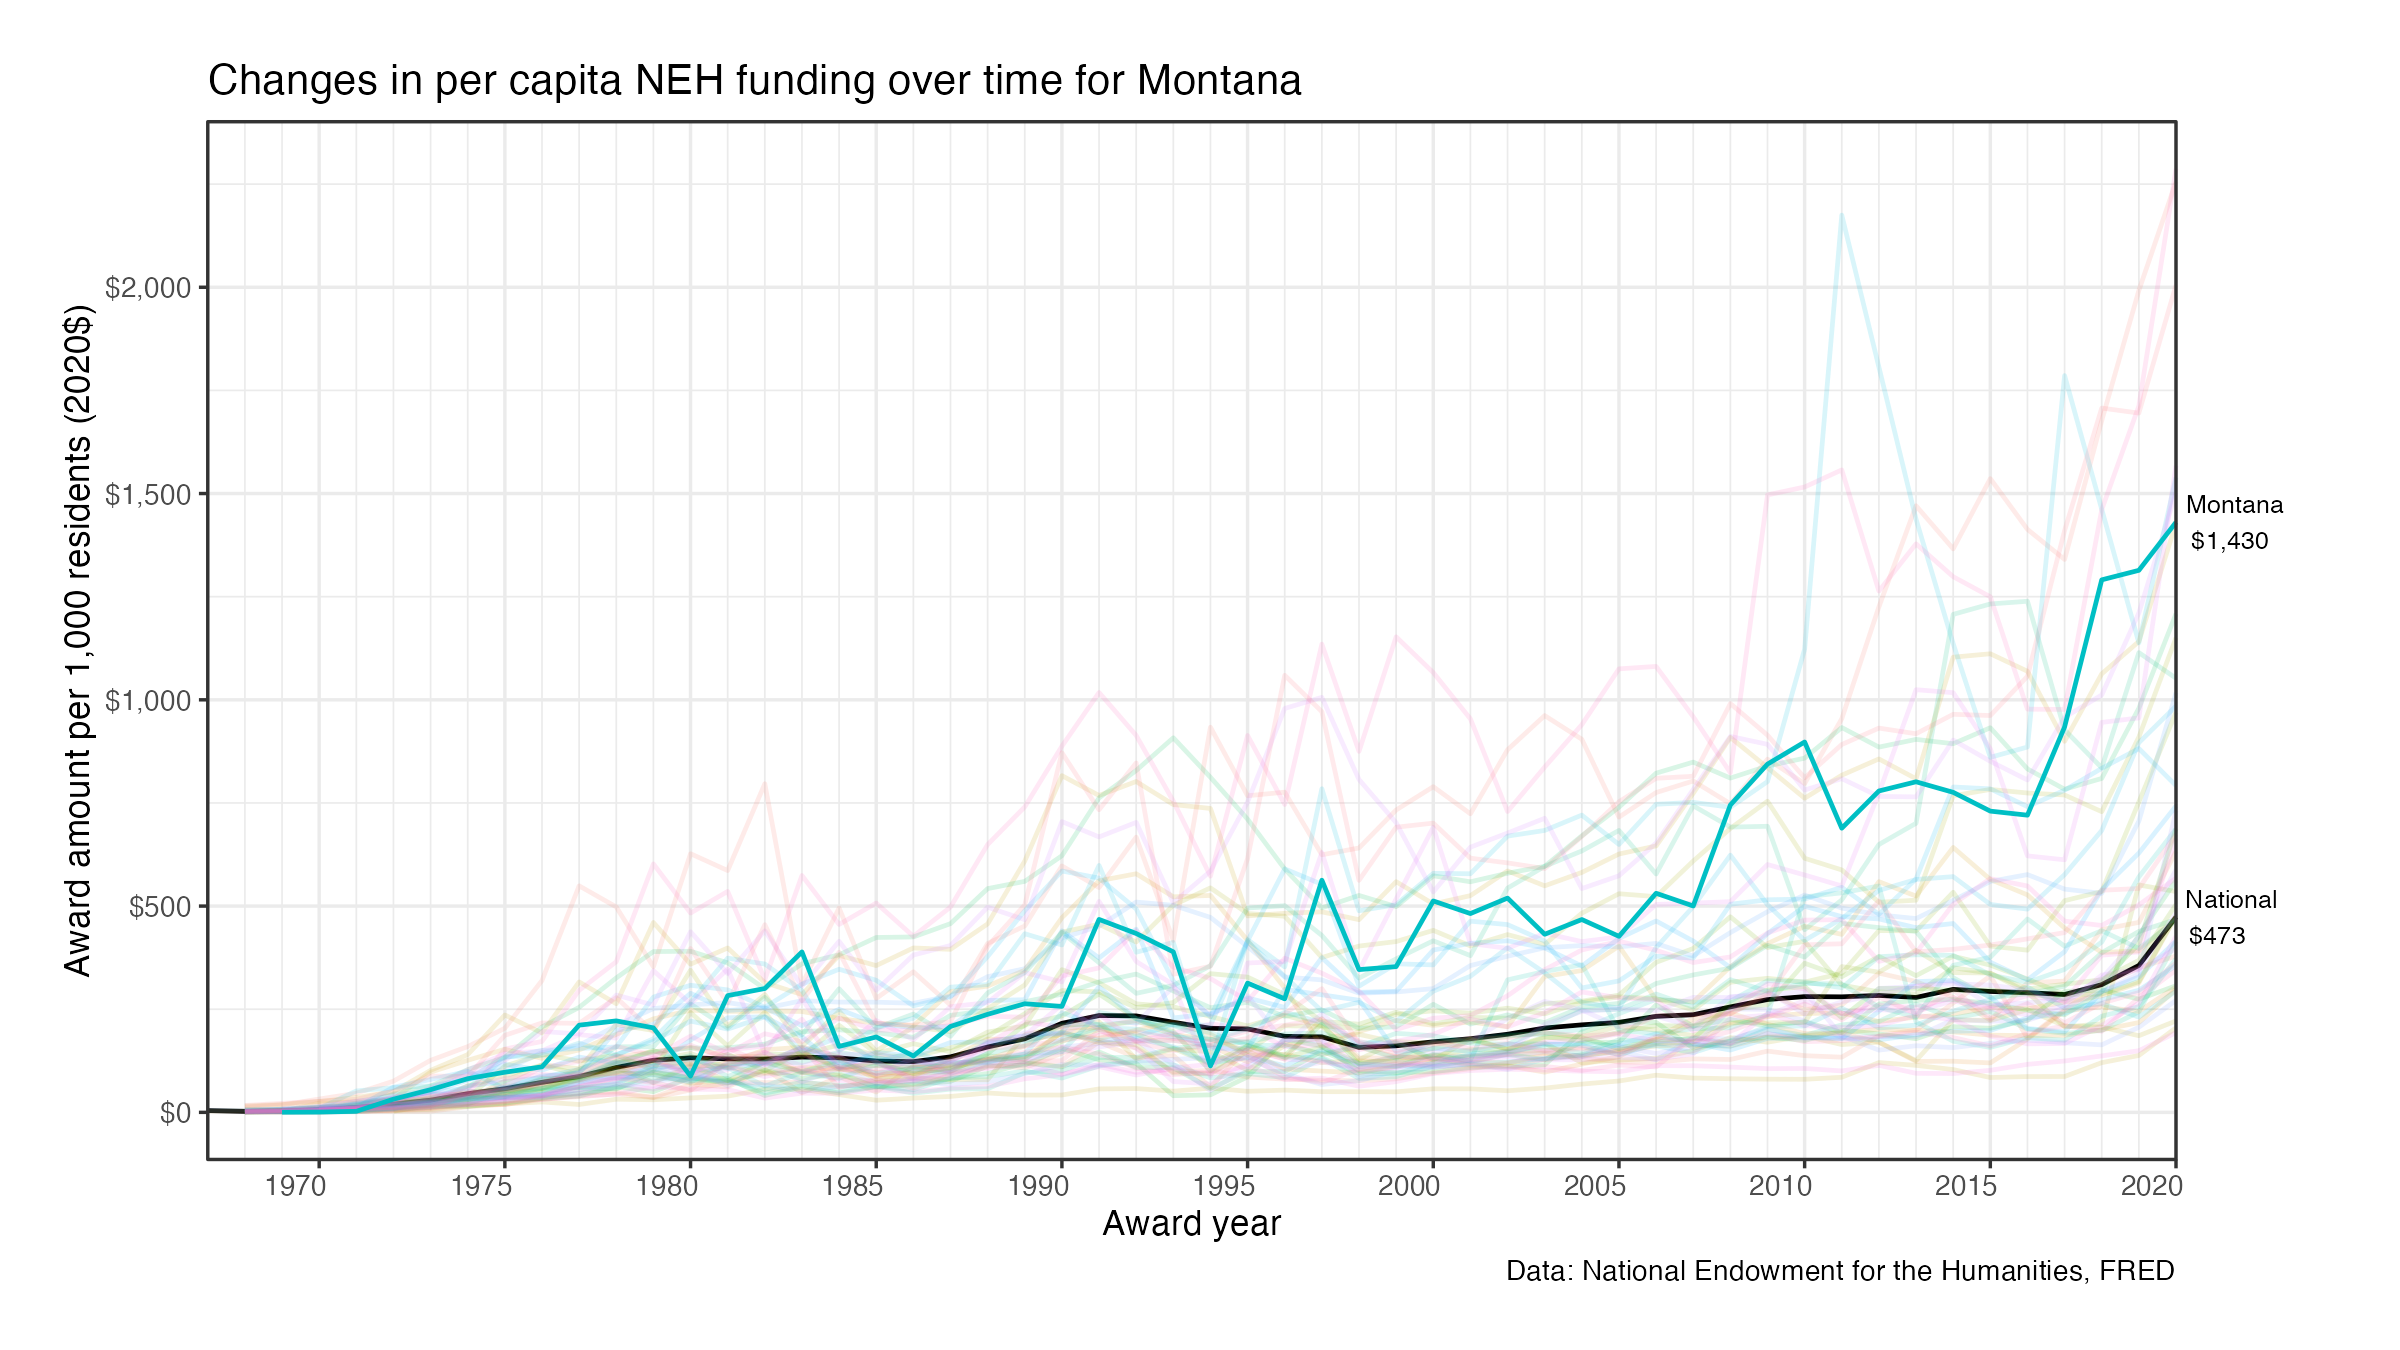
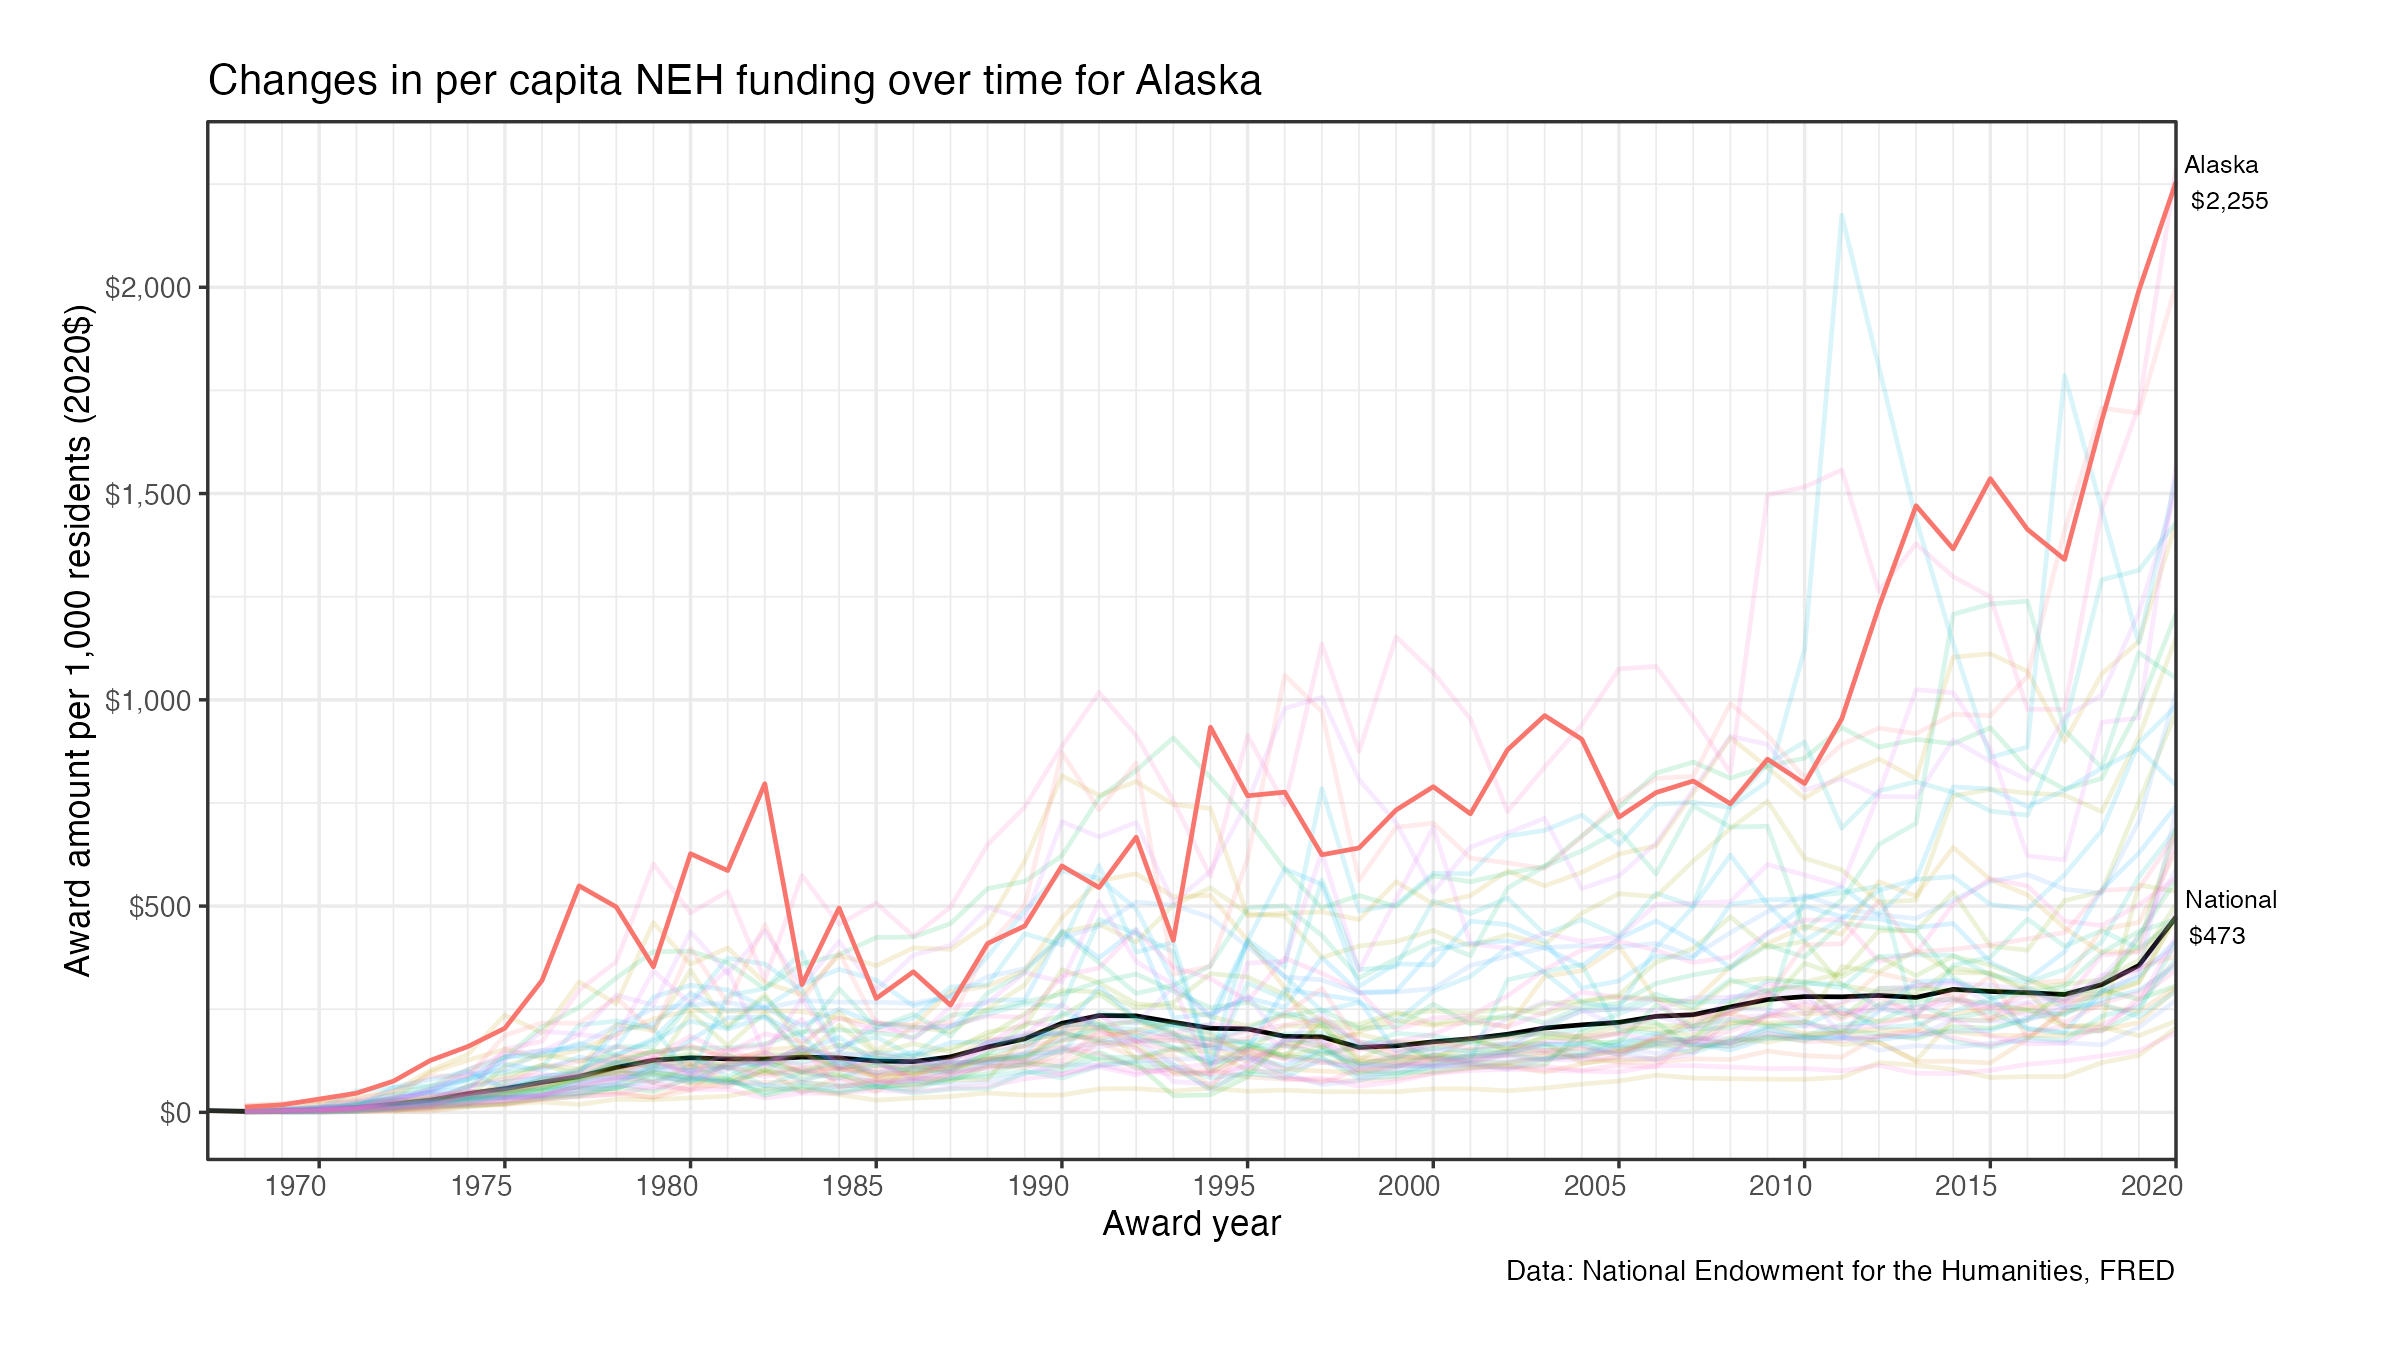
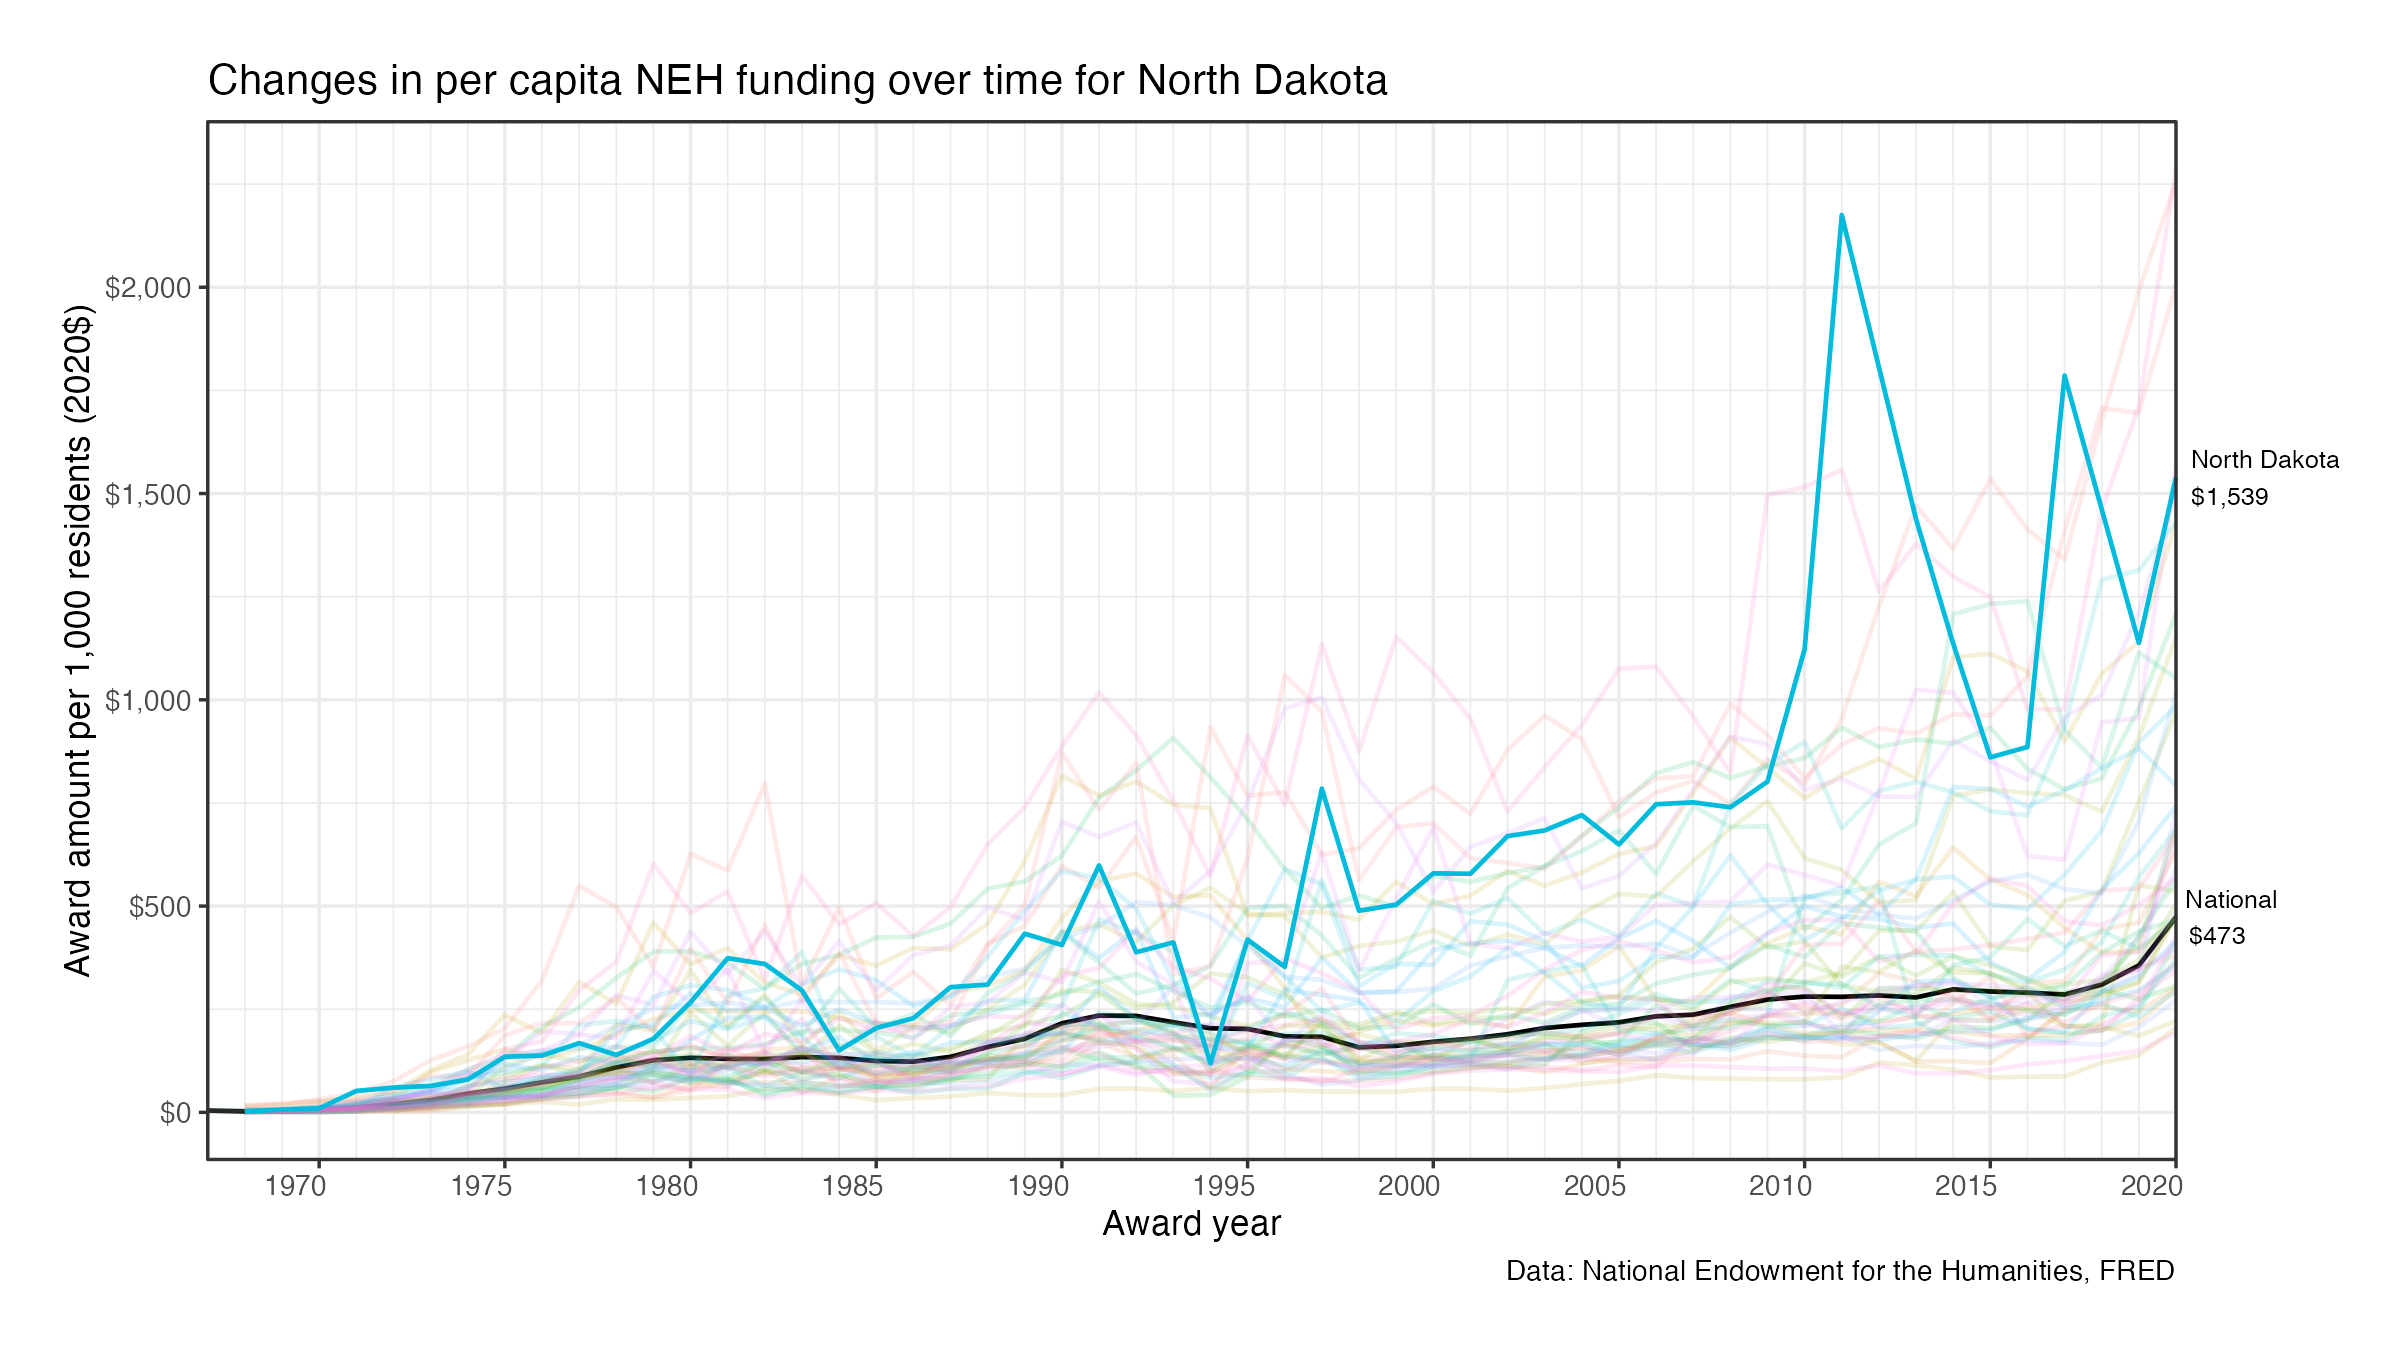
In comparison, residents of Massachusetts have consistently received large per capita NEH award amounts (green line). Ending in 2020, Massachusetts residents received $1,209 per 1,000 persons, their highest ever. Massachusetts was awarded over $900 (inflation adjusted to 2020 dollars) per 1,000 residents in five other years (1993, 2011, 2013, 2015, and 2019). A few other states, such as Alaska, Montana, and North Dakota have also consistently received high per capita funding over time. However, the sparse populations of these states mean that even comparatively smaller award amounts will be realized as higher per capita values.
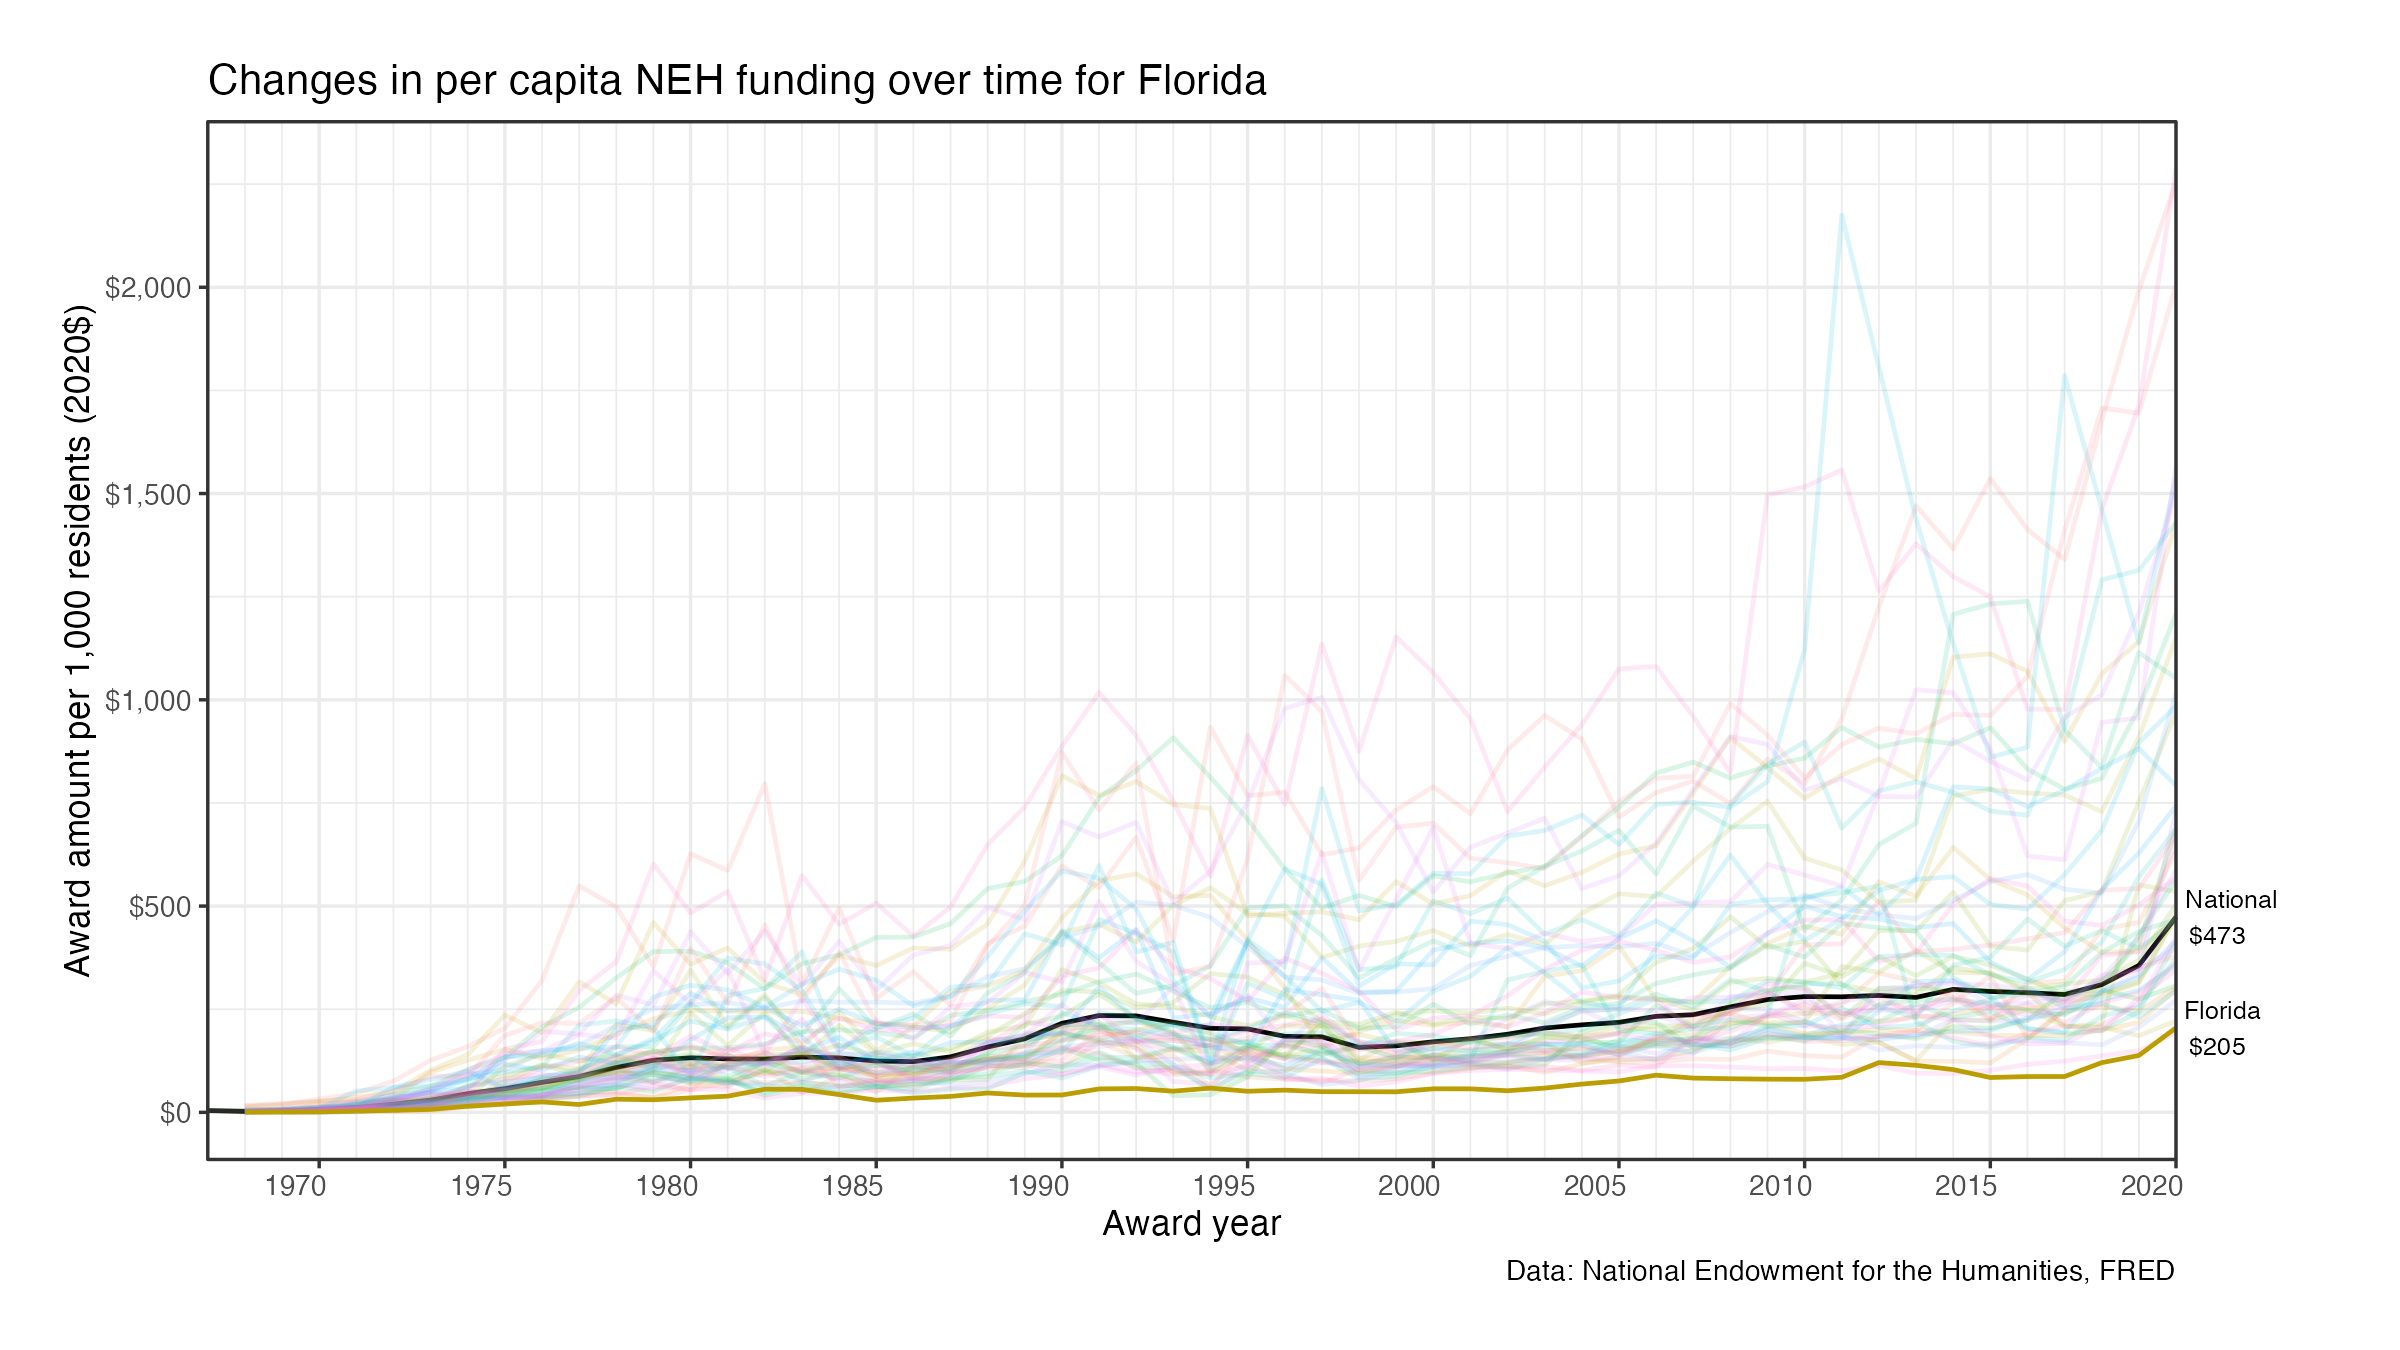
On the other side, the state of Florida has consistently had a low per capita award rate (gold line). In 2020, Floridians received the most they ever have, $205 per 1000 residents, which only slightly higher than Texas’s $193, the lowest in the nation. In no year since the start of the NEH have Florida residents received at or above the national average. Adjusting for inflation, Florida residents at their highest per capita funding received more than Massachusetts residents only in the latter’s eight lowest funded years, 1968-1975.
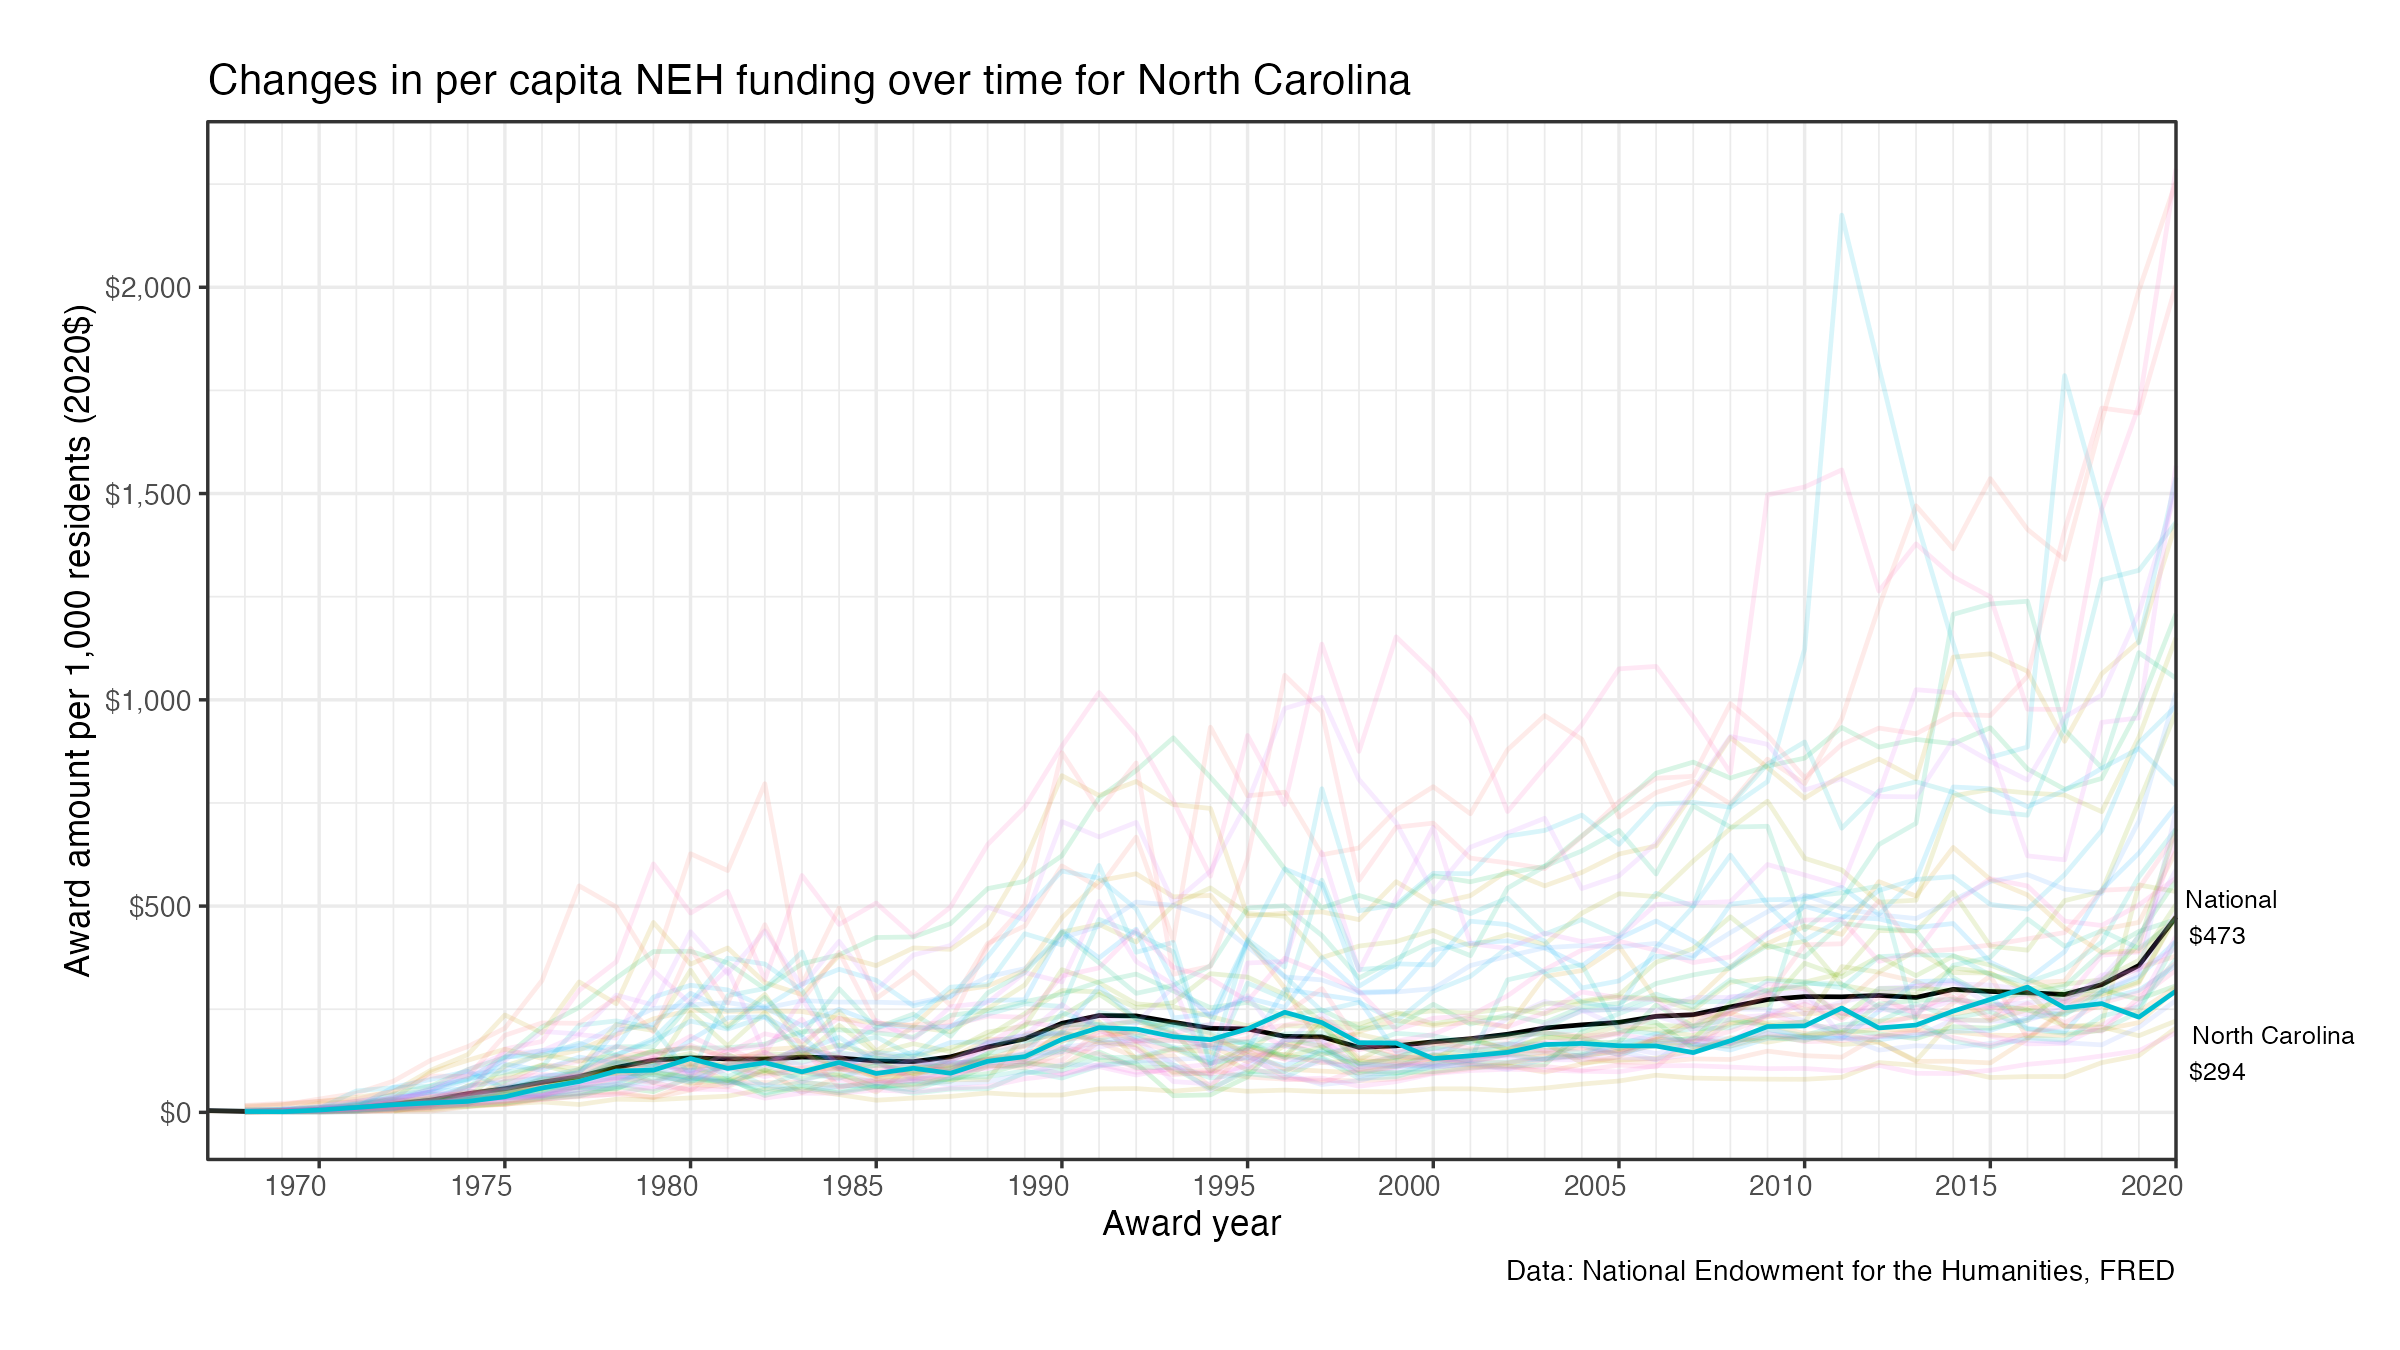
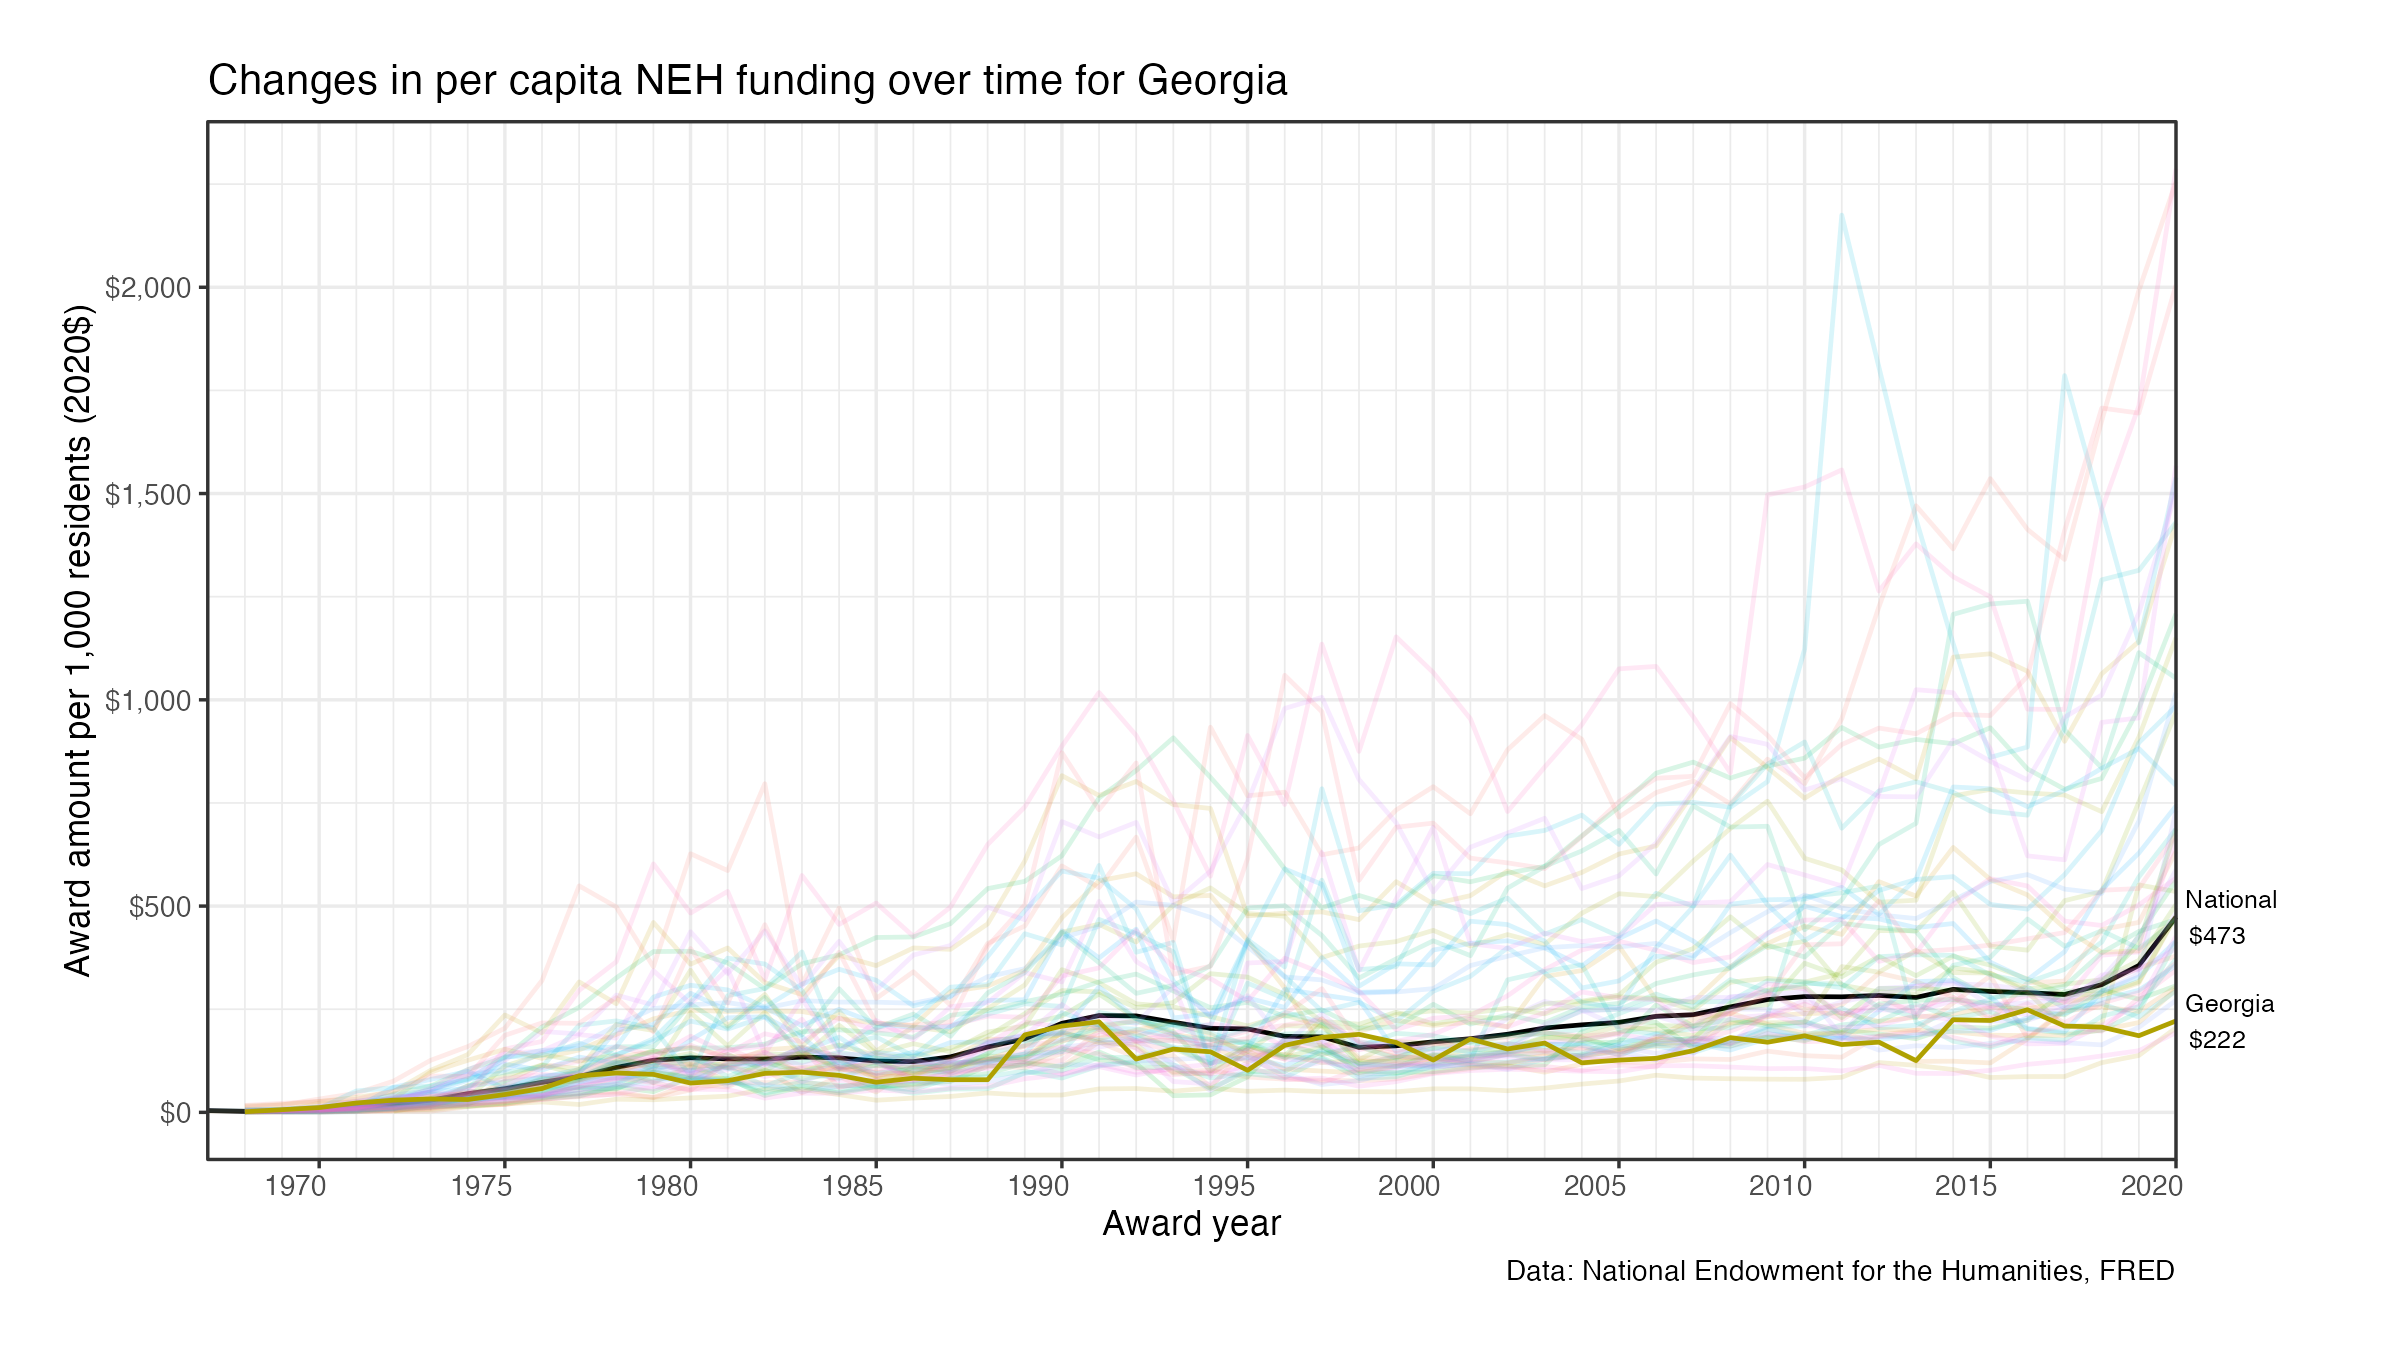
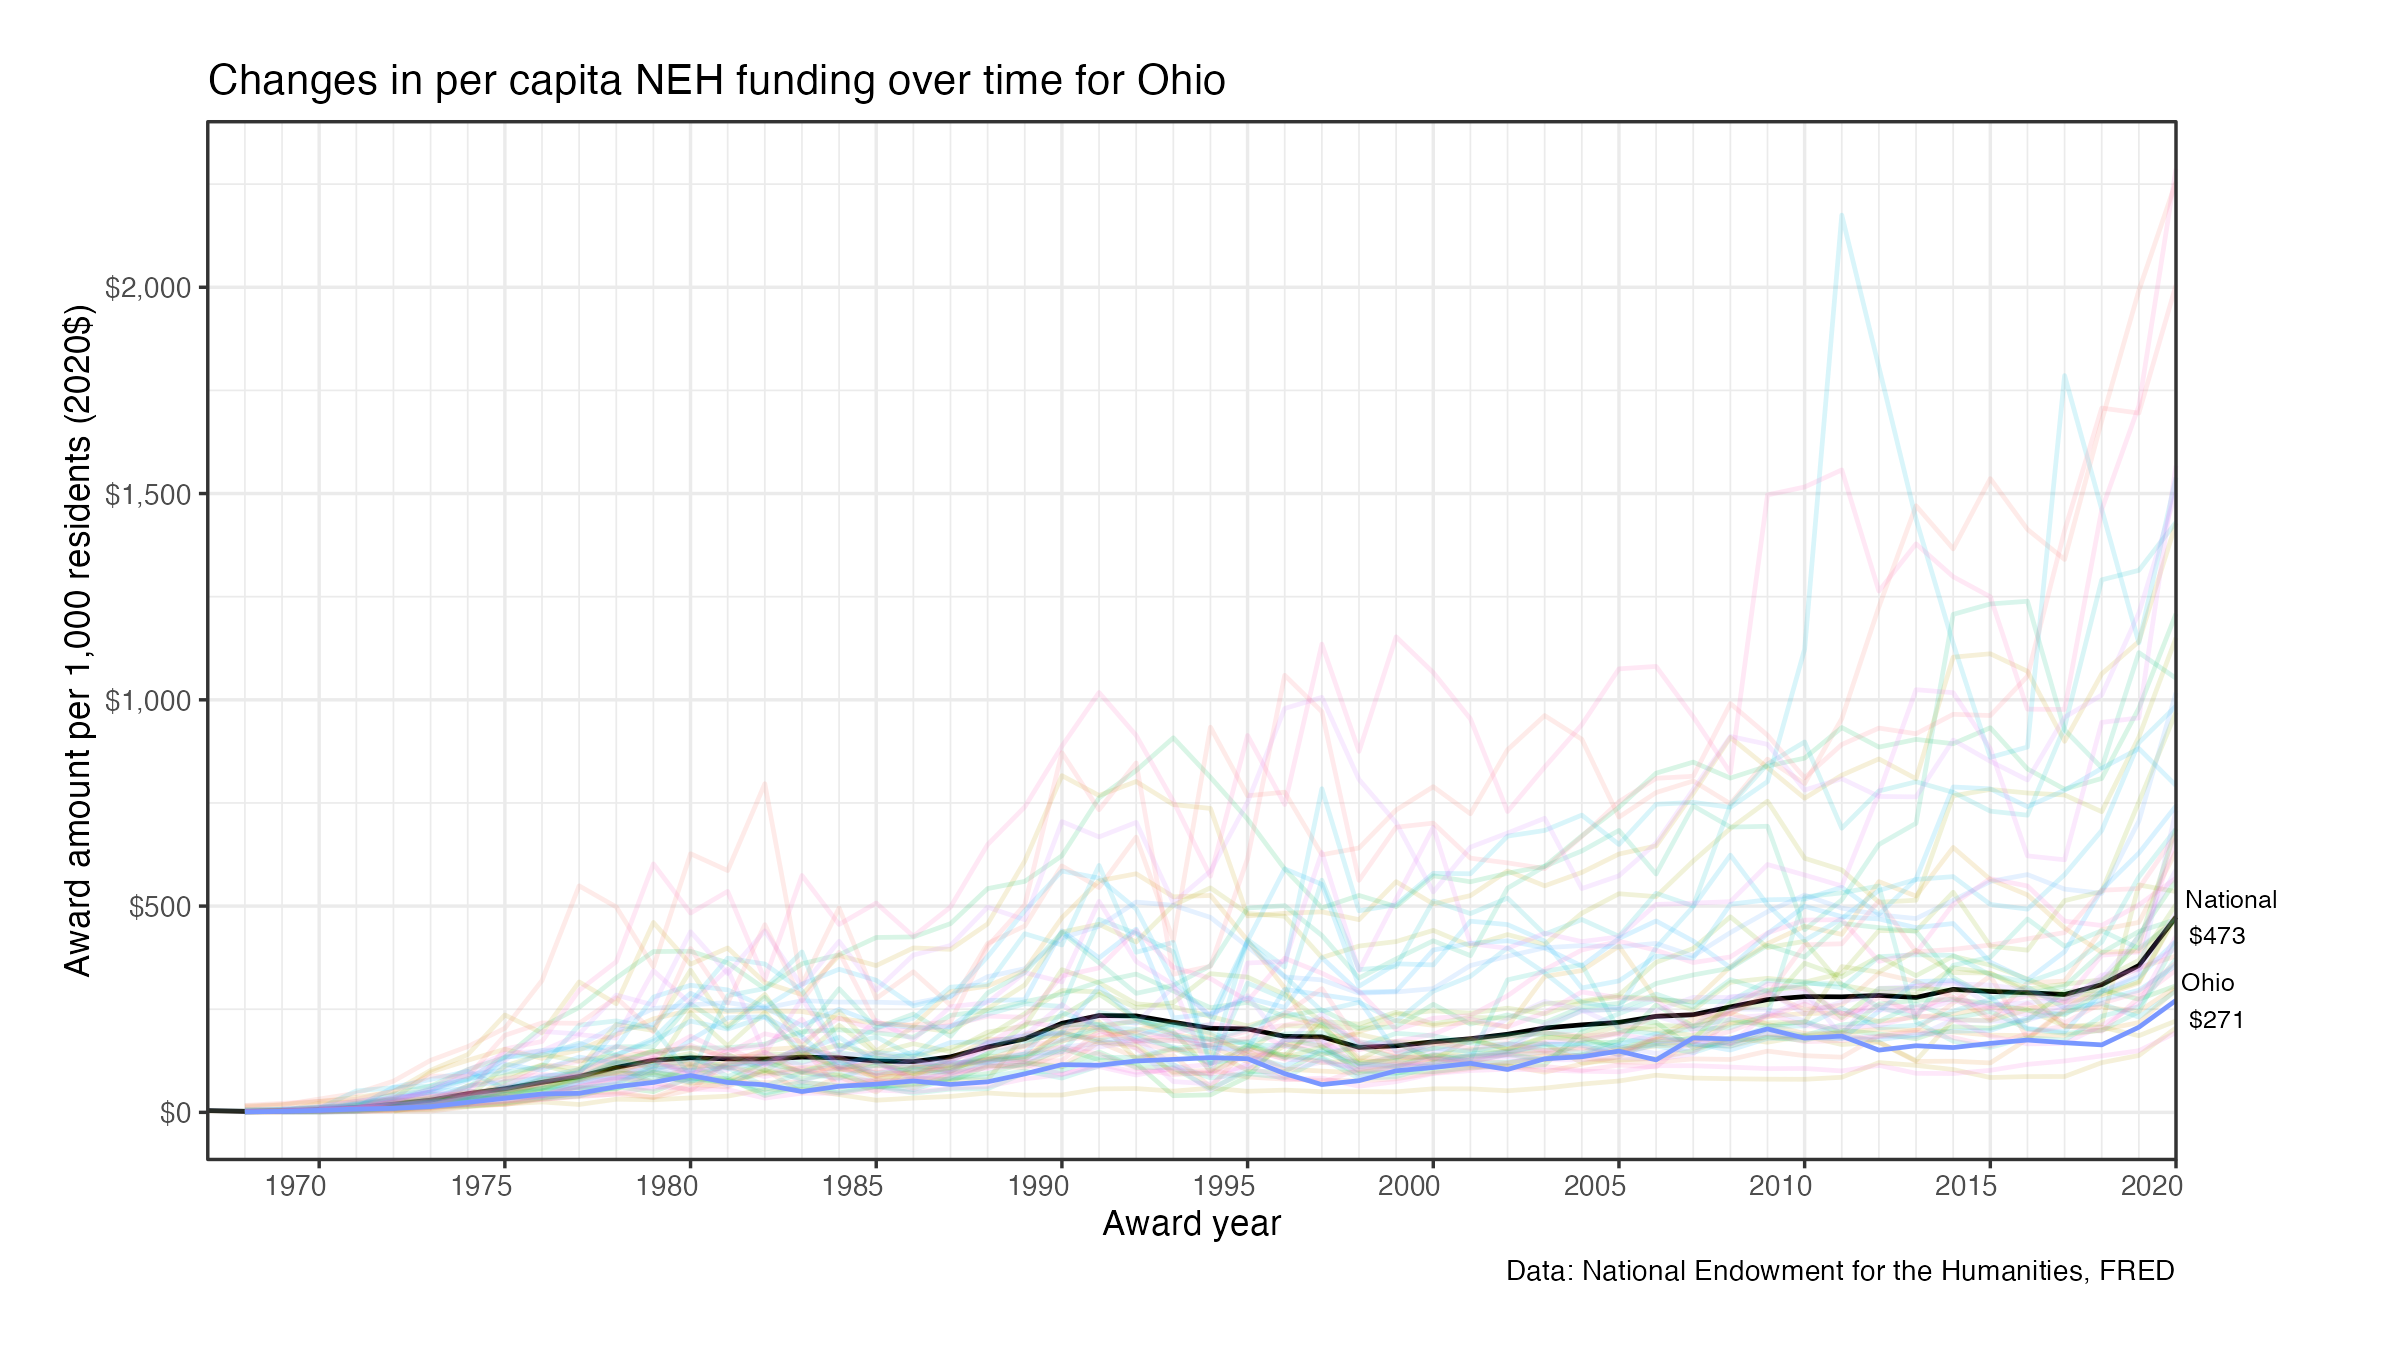
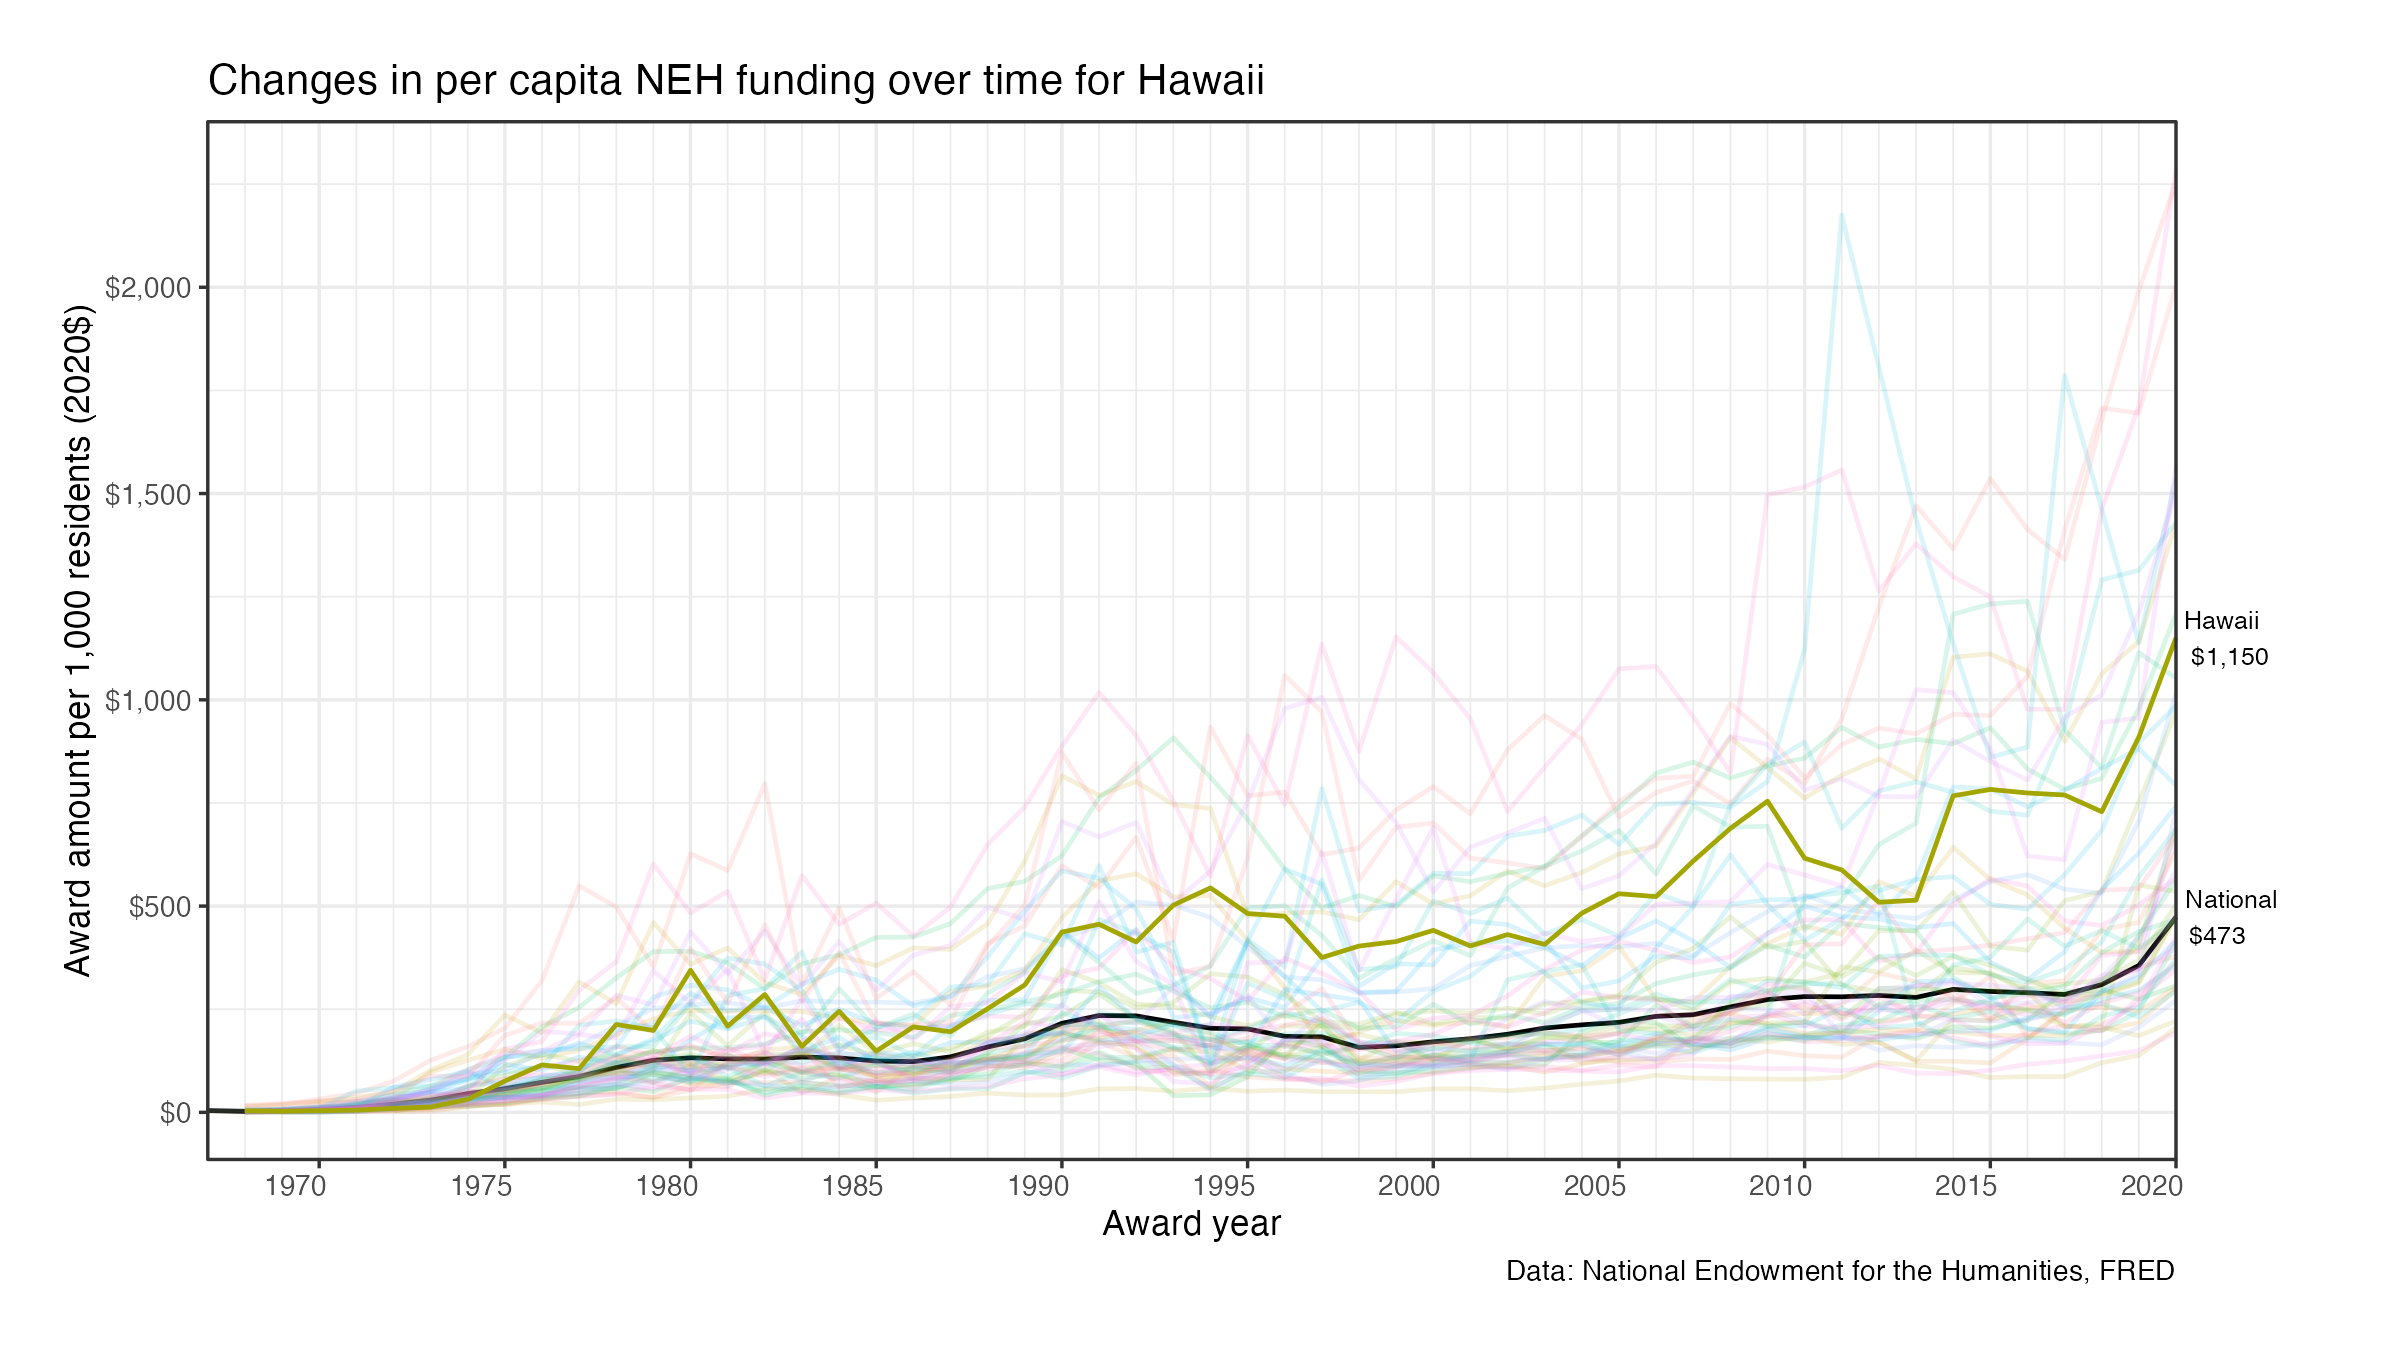
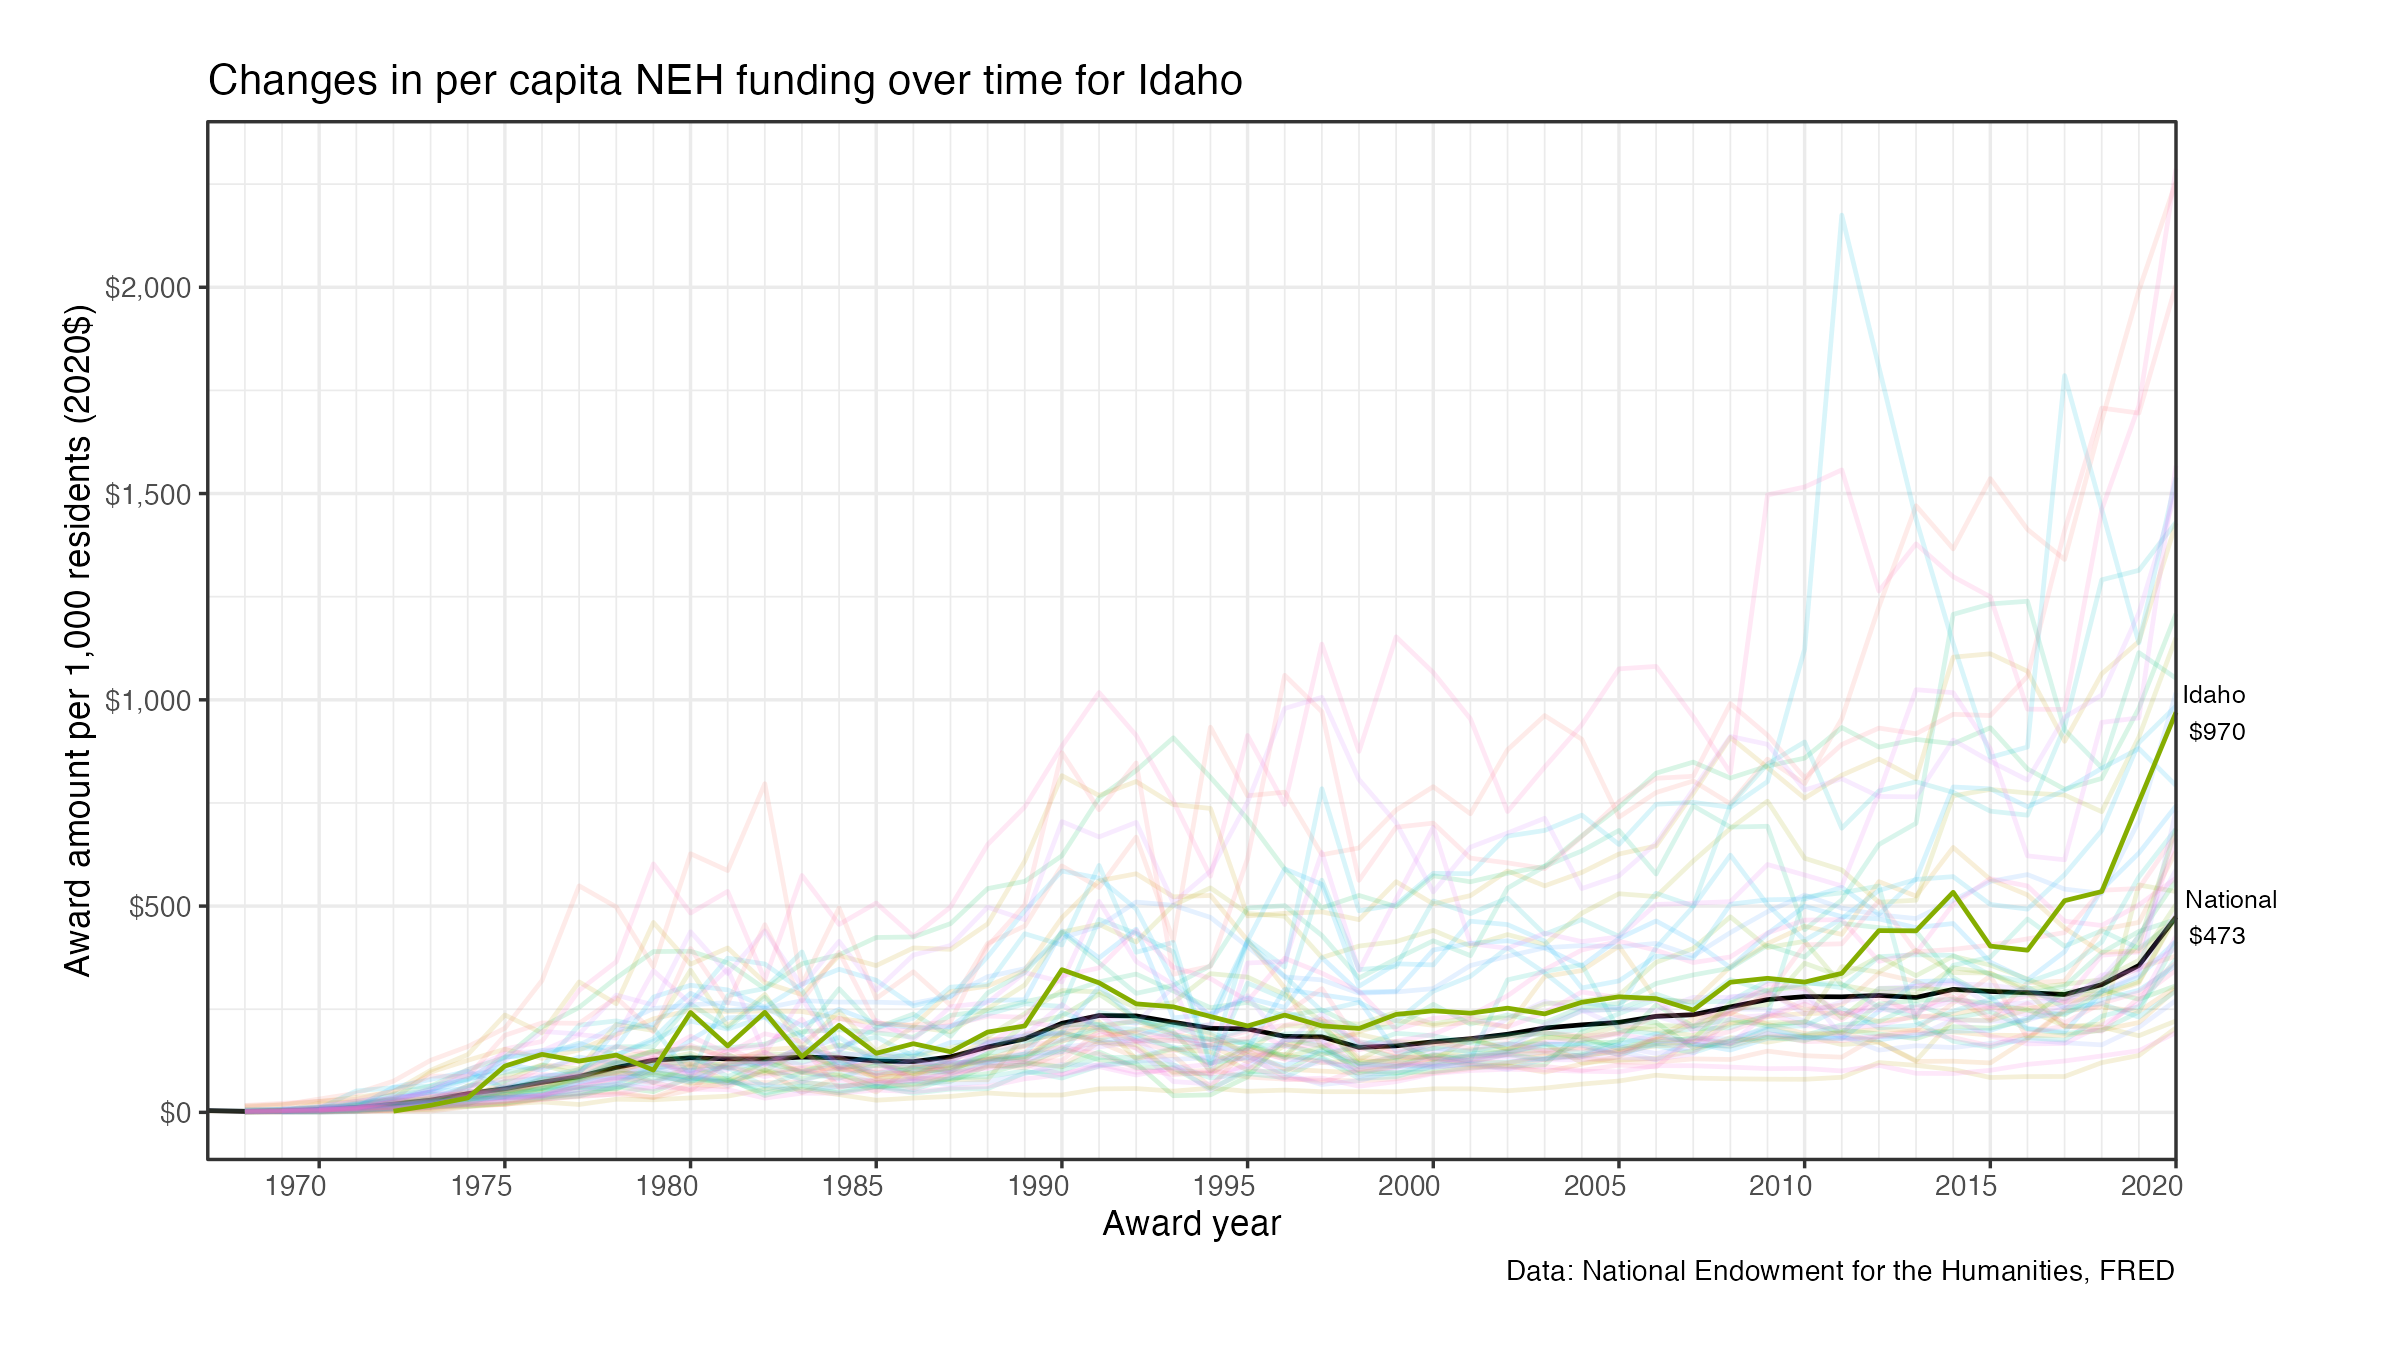
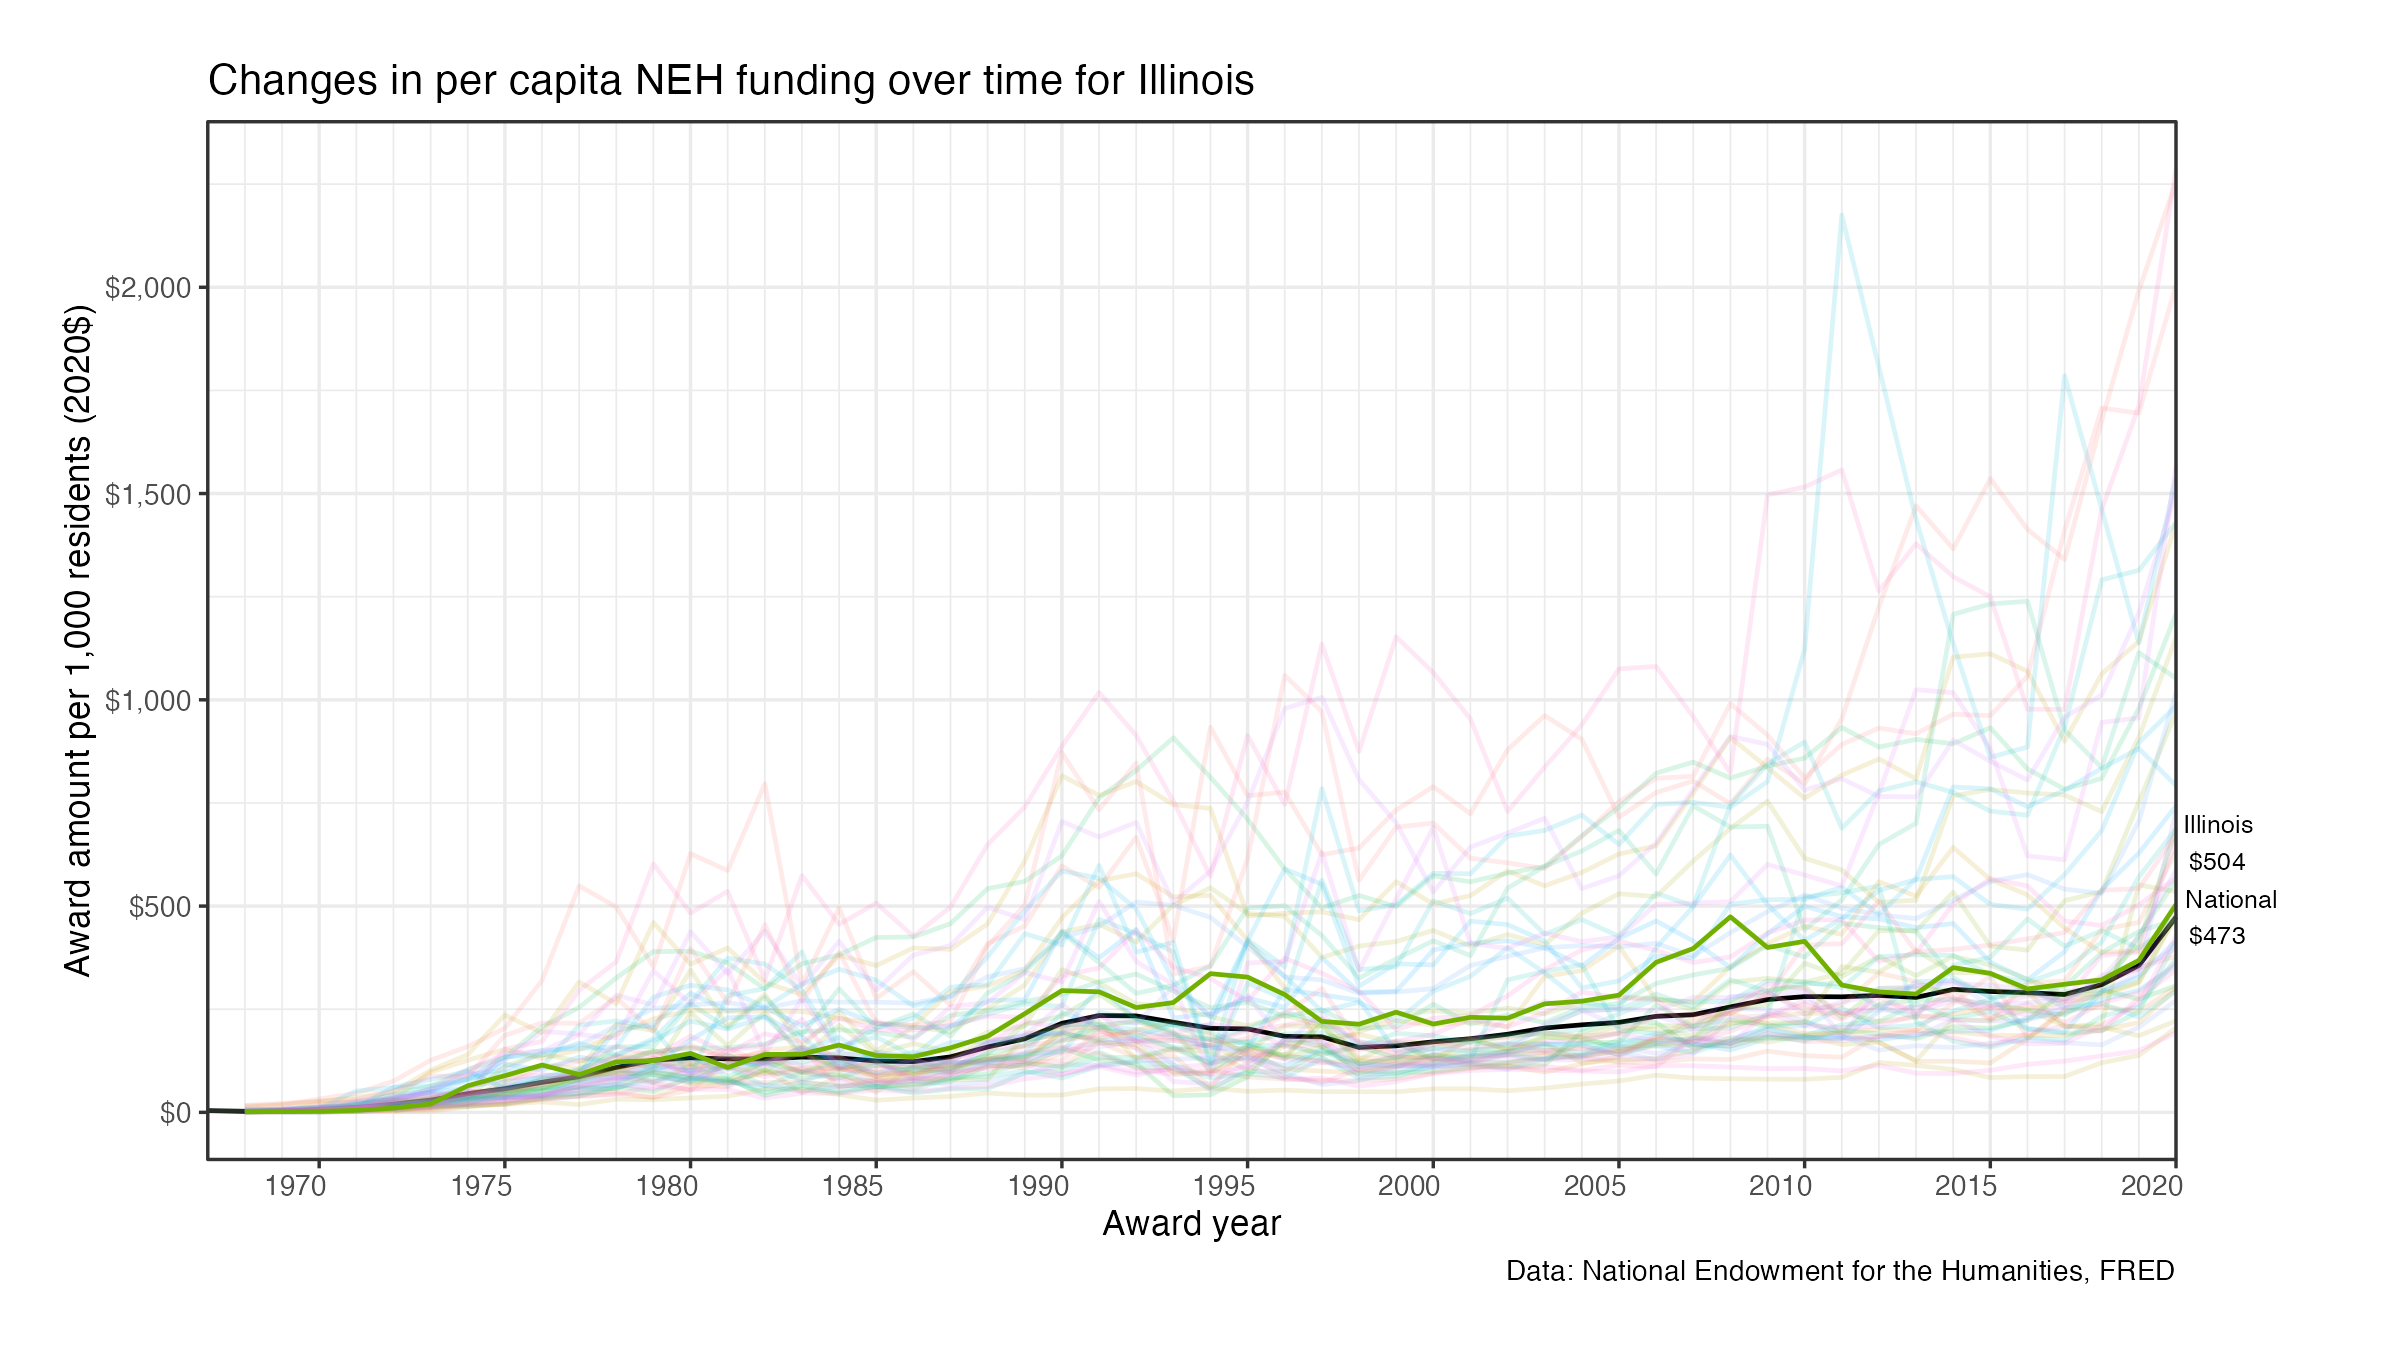
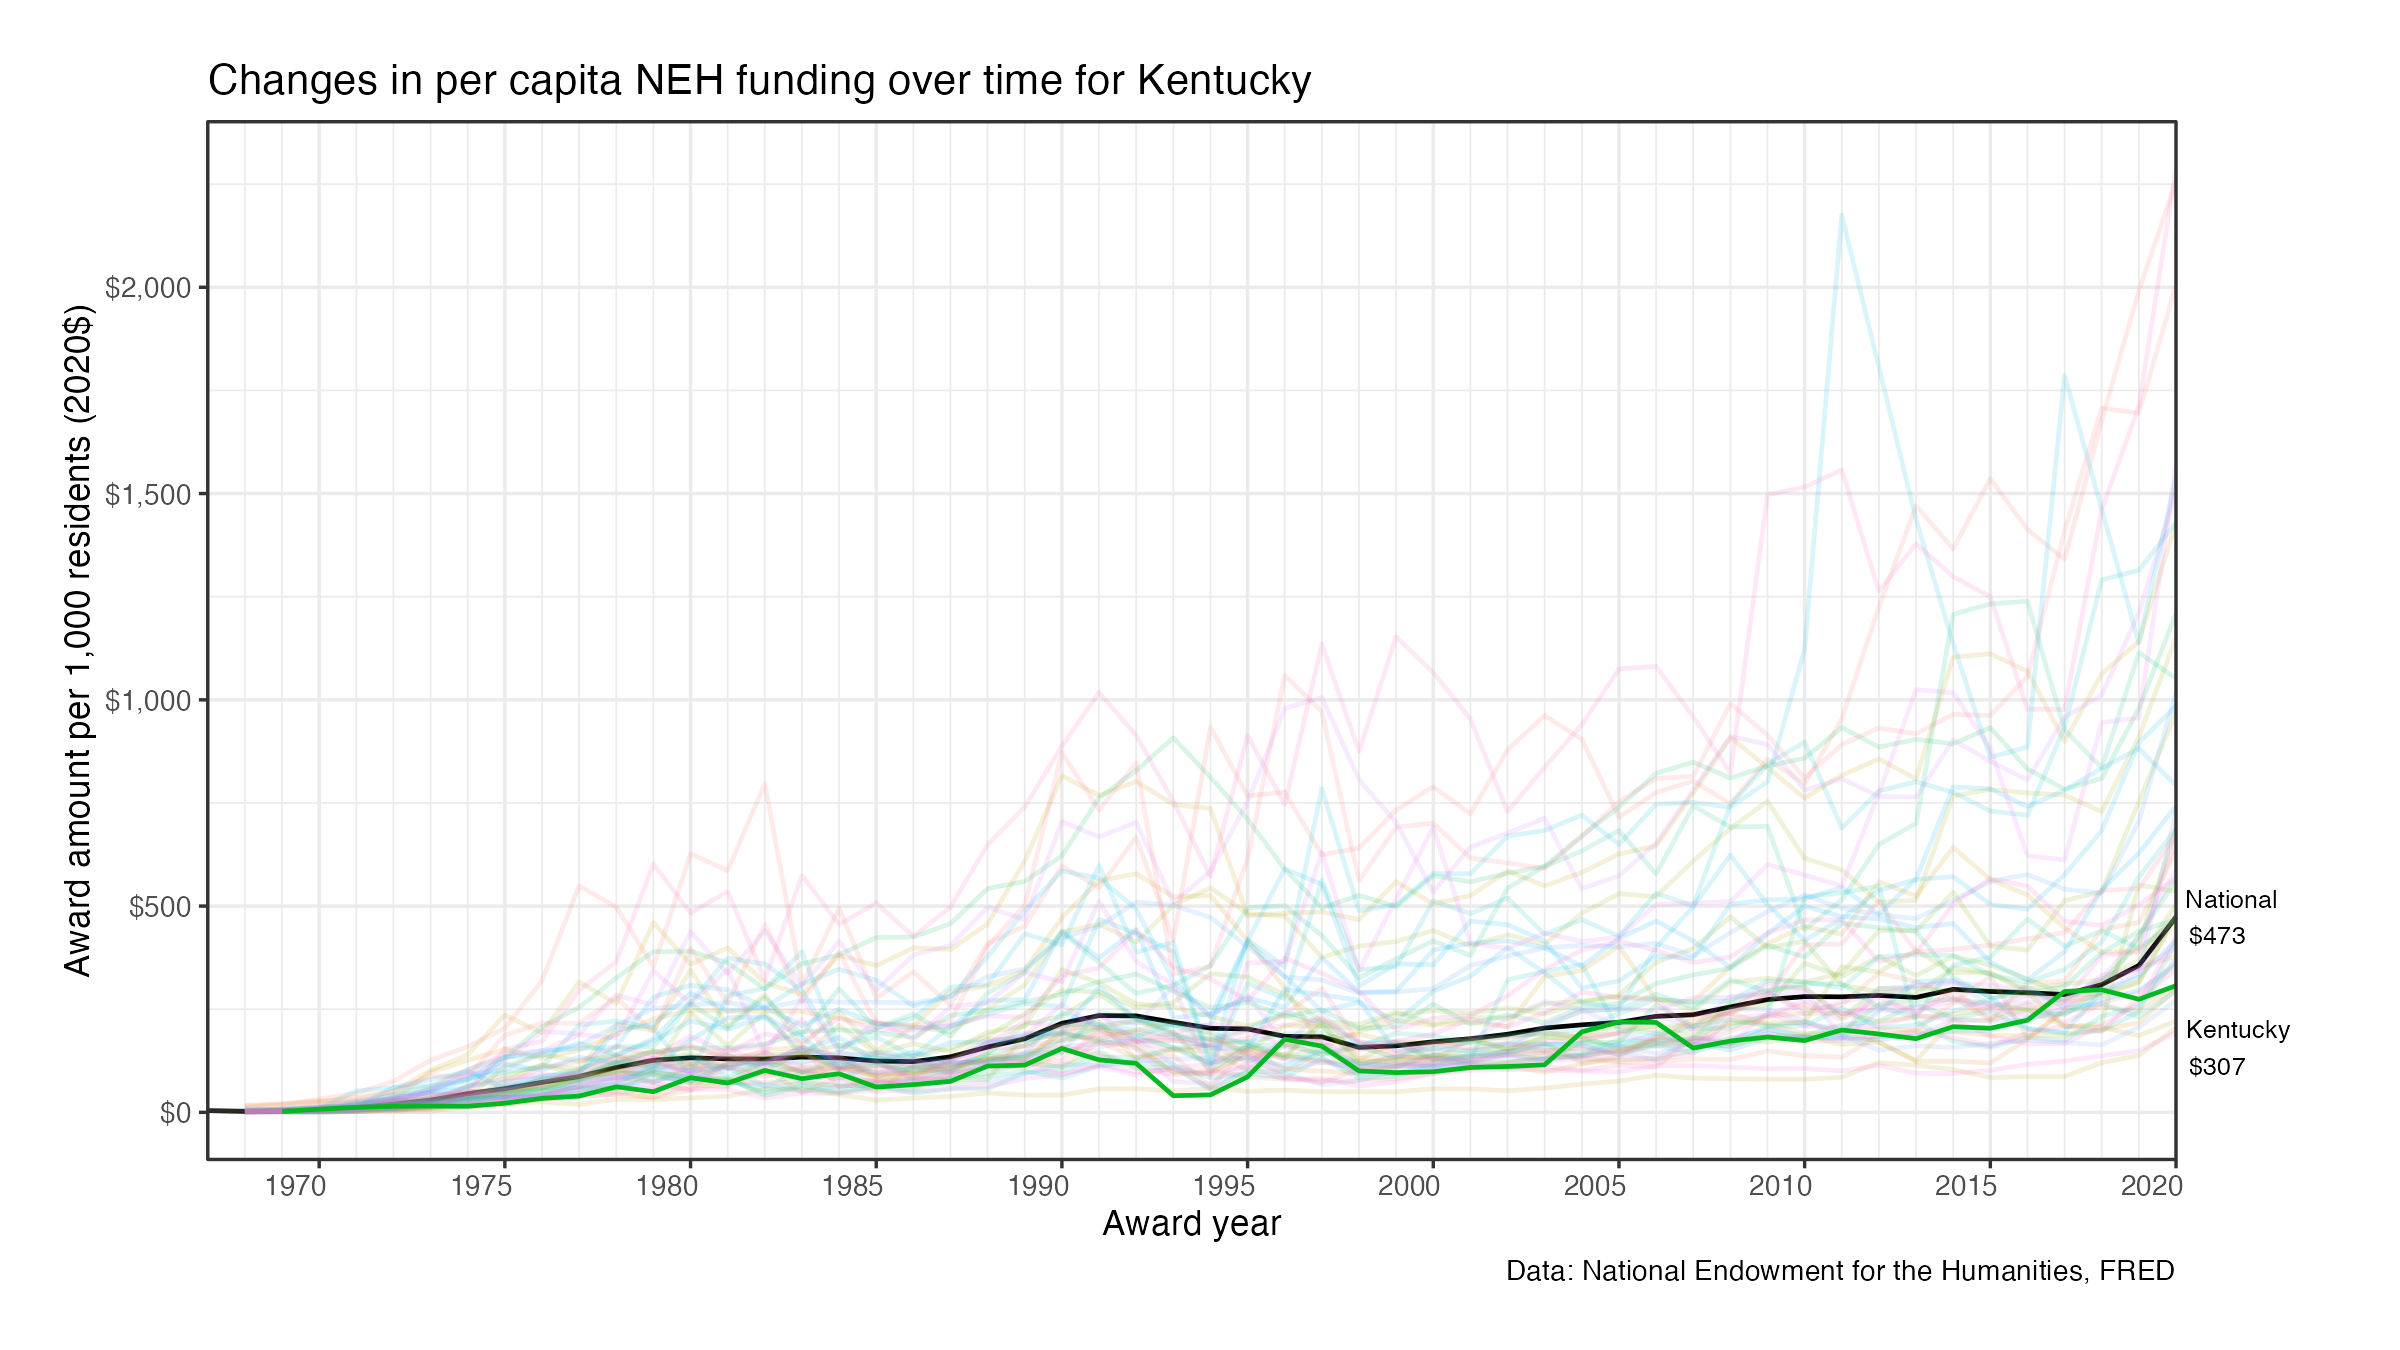
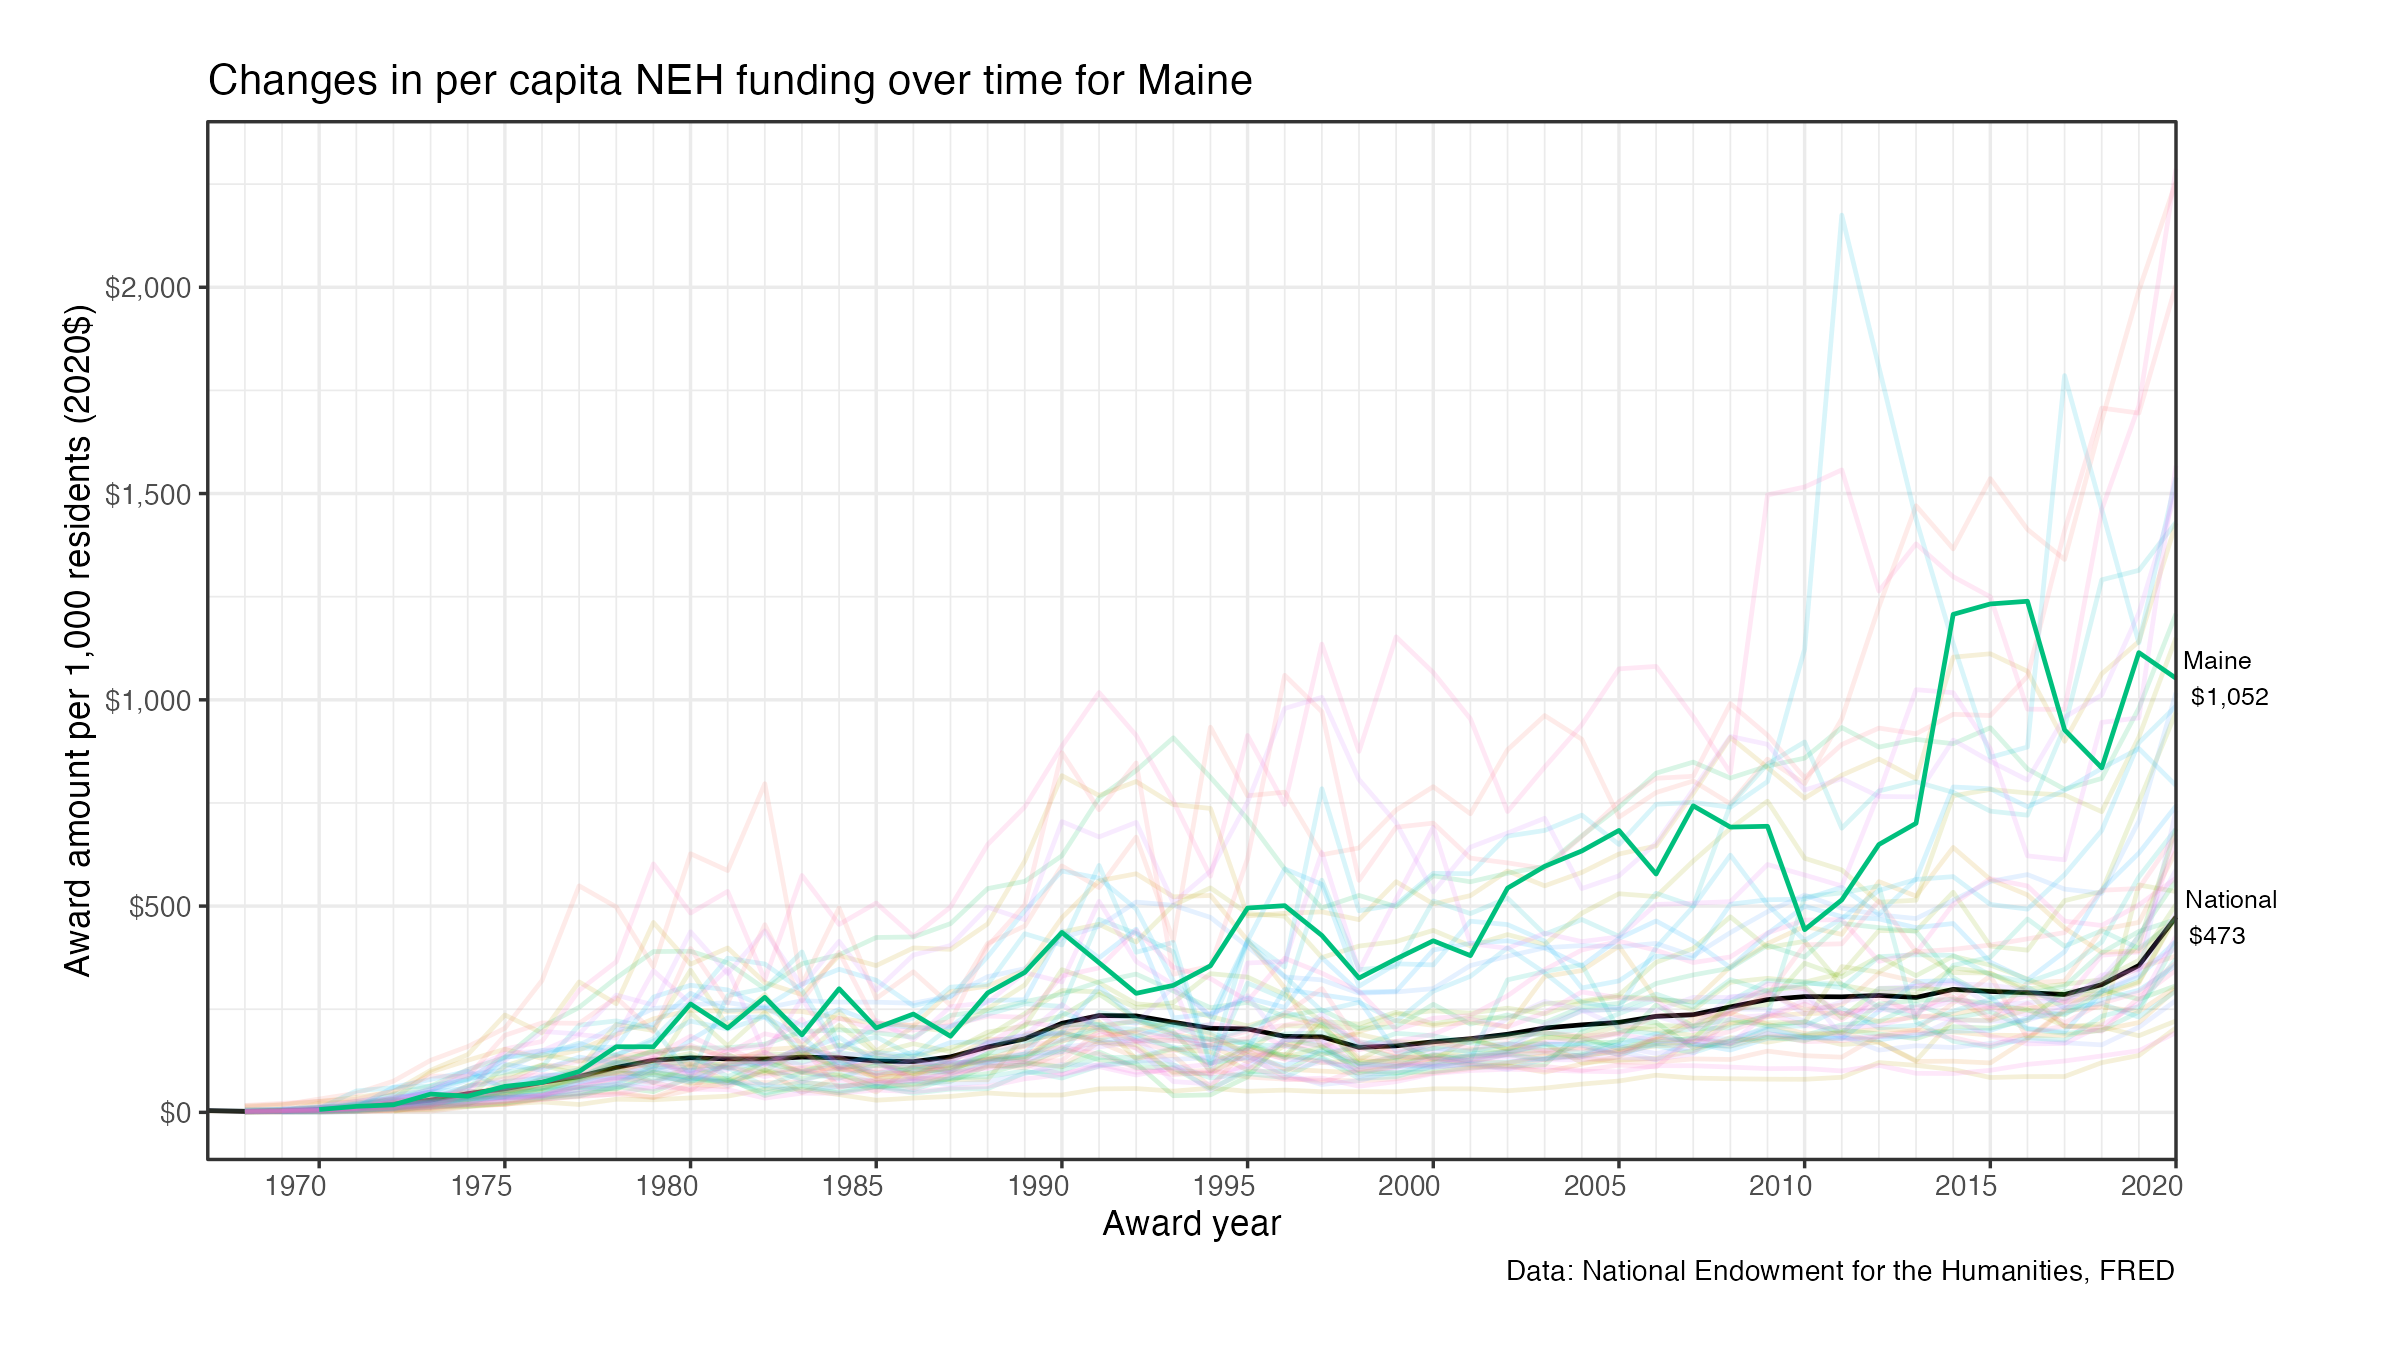
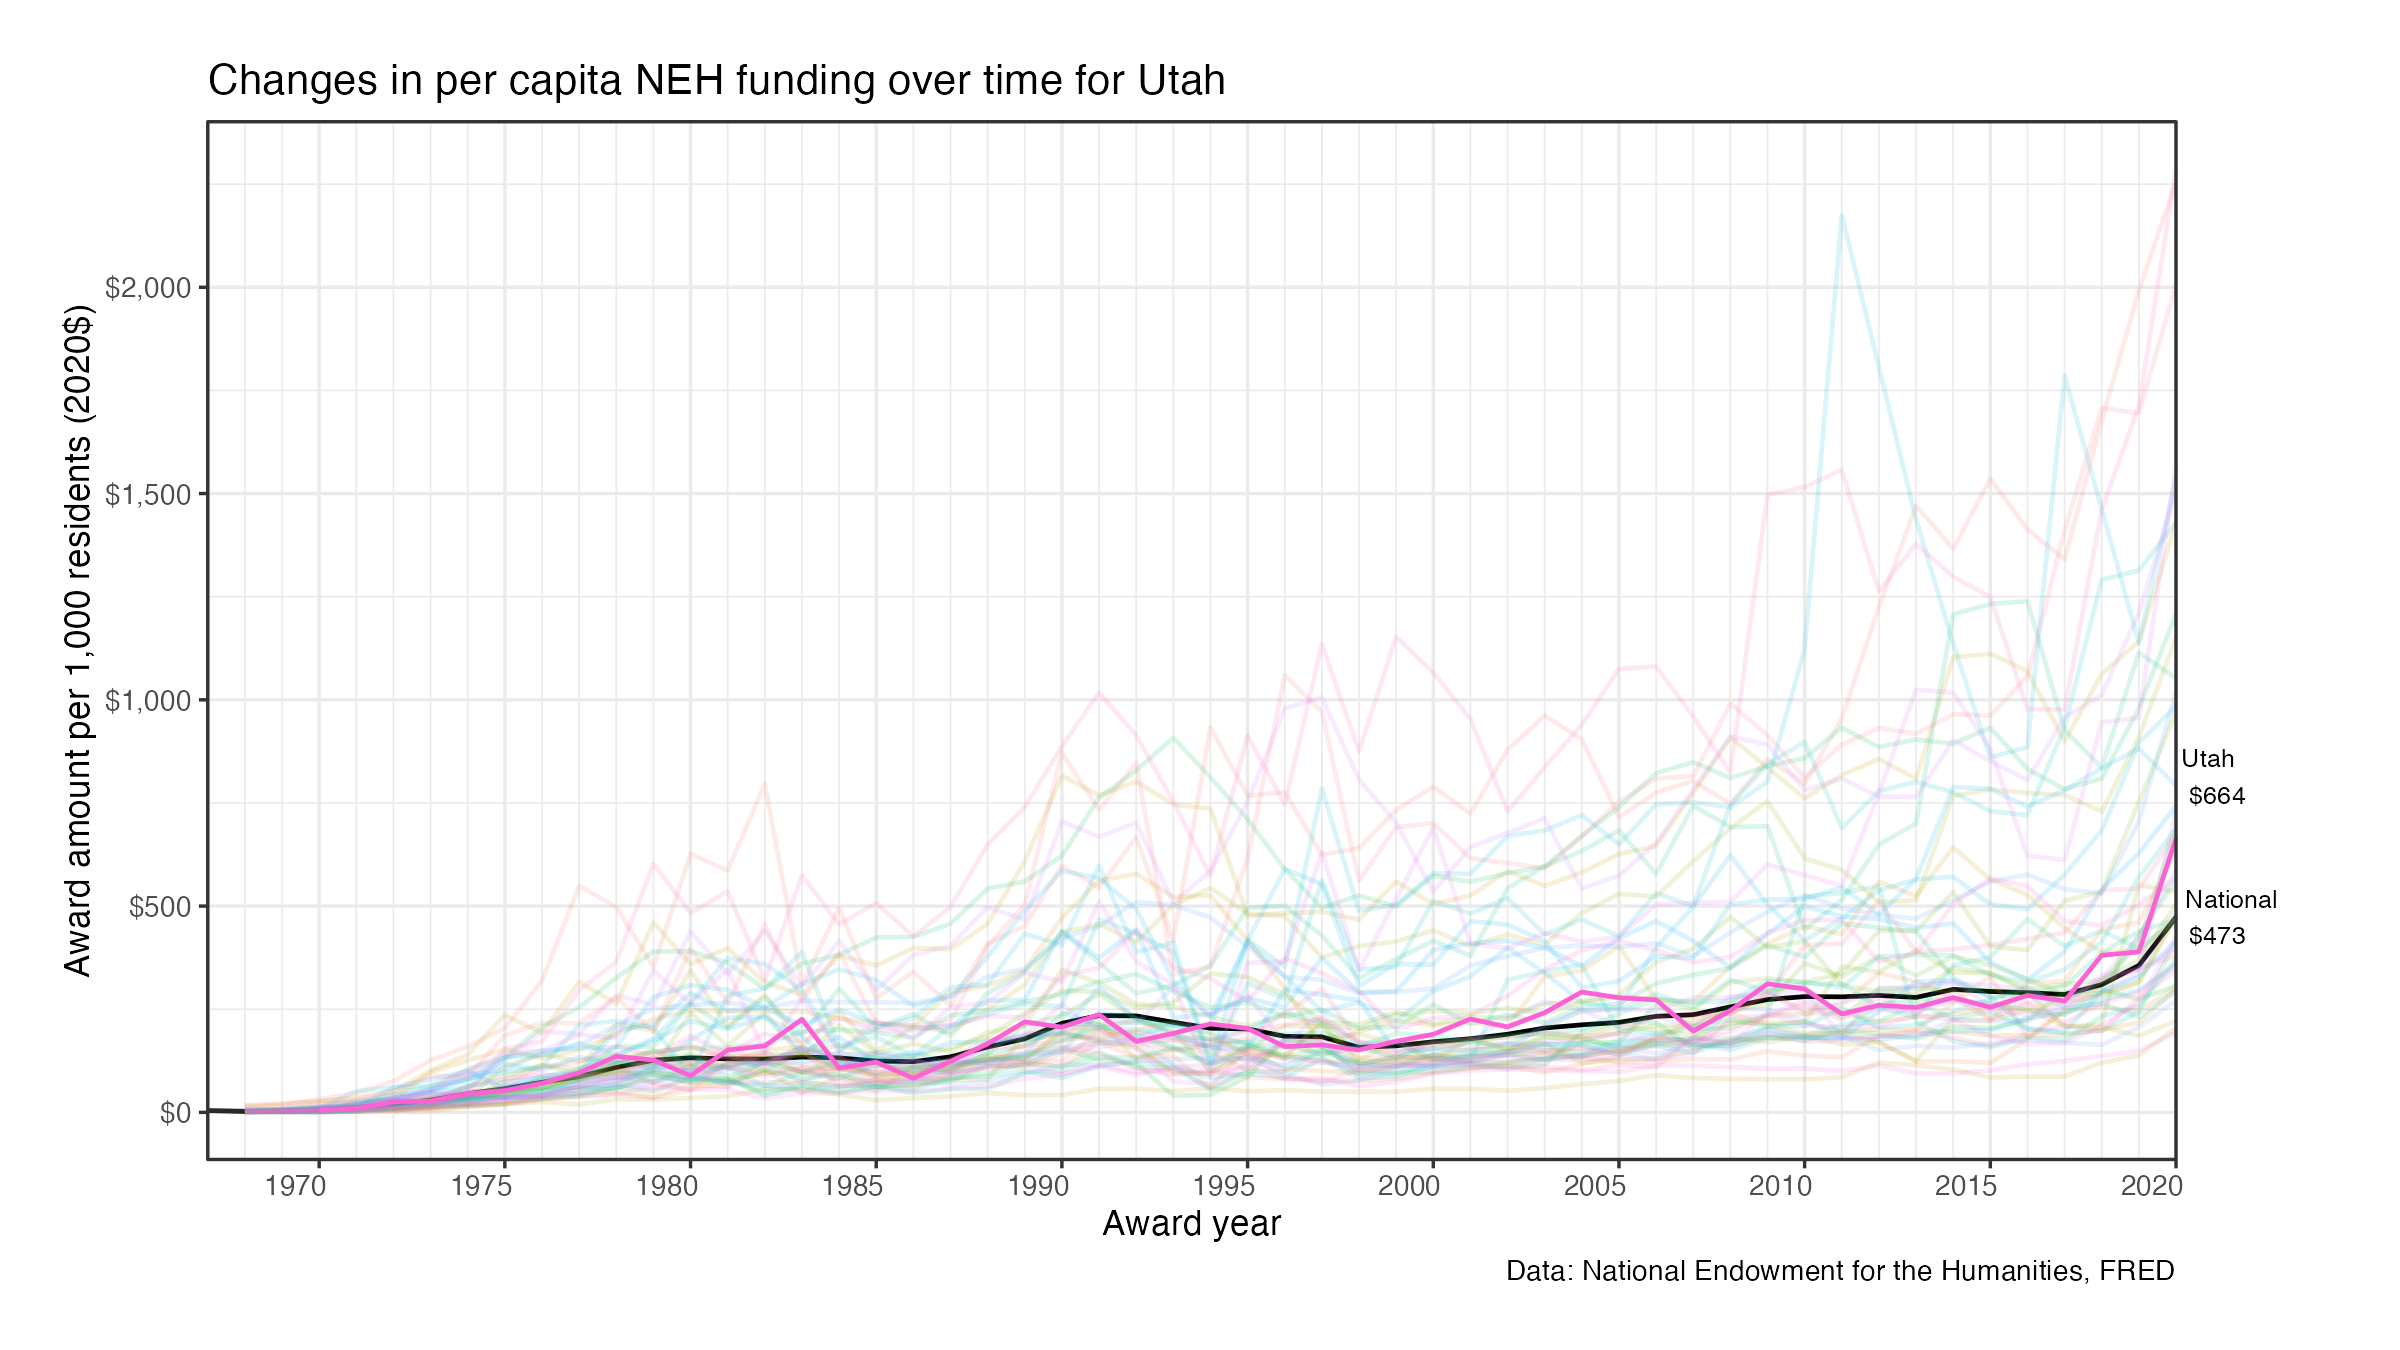
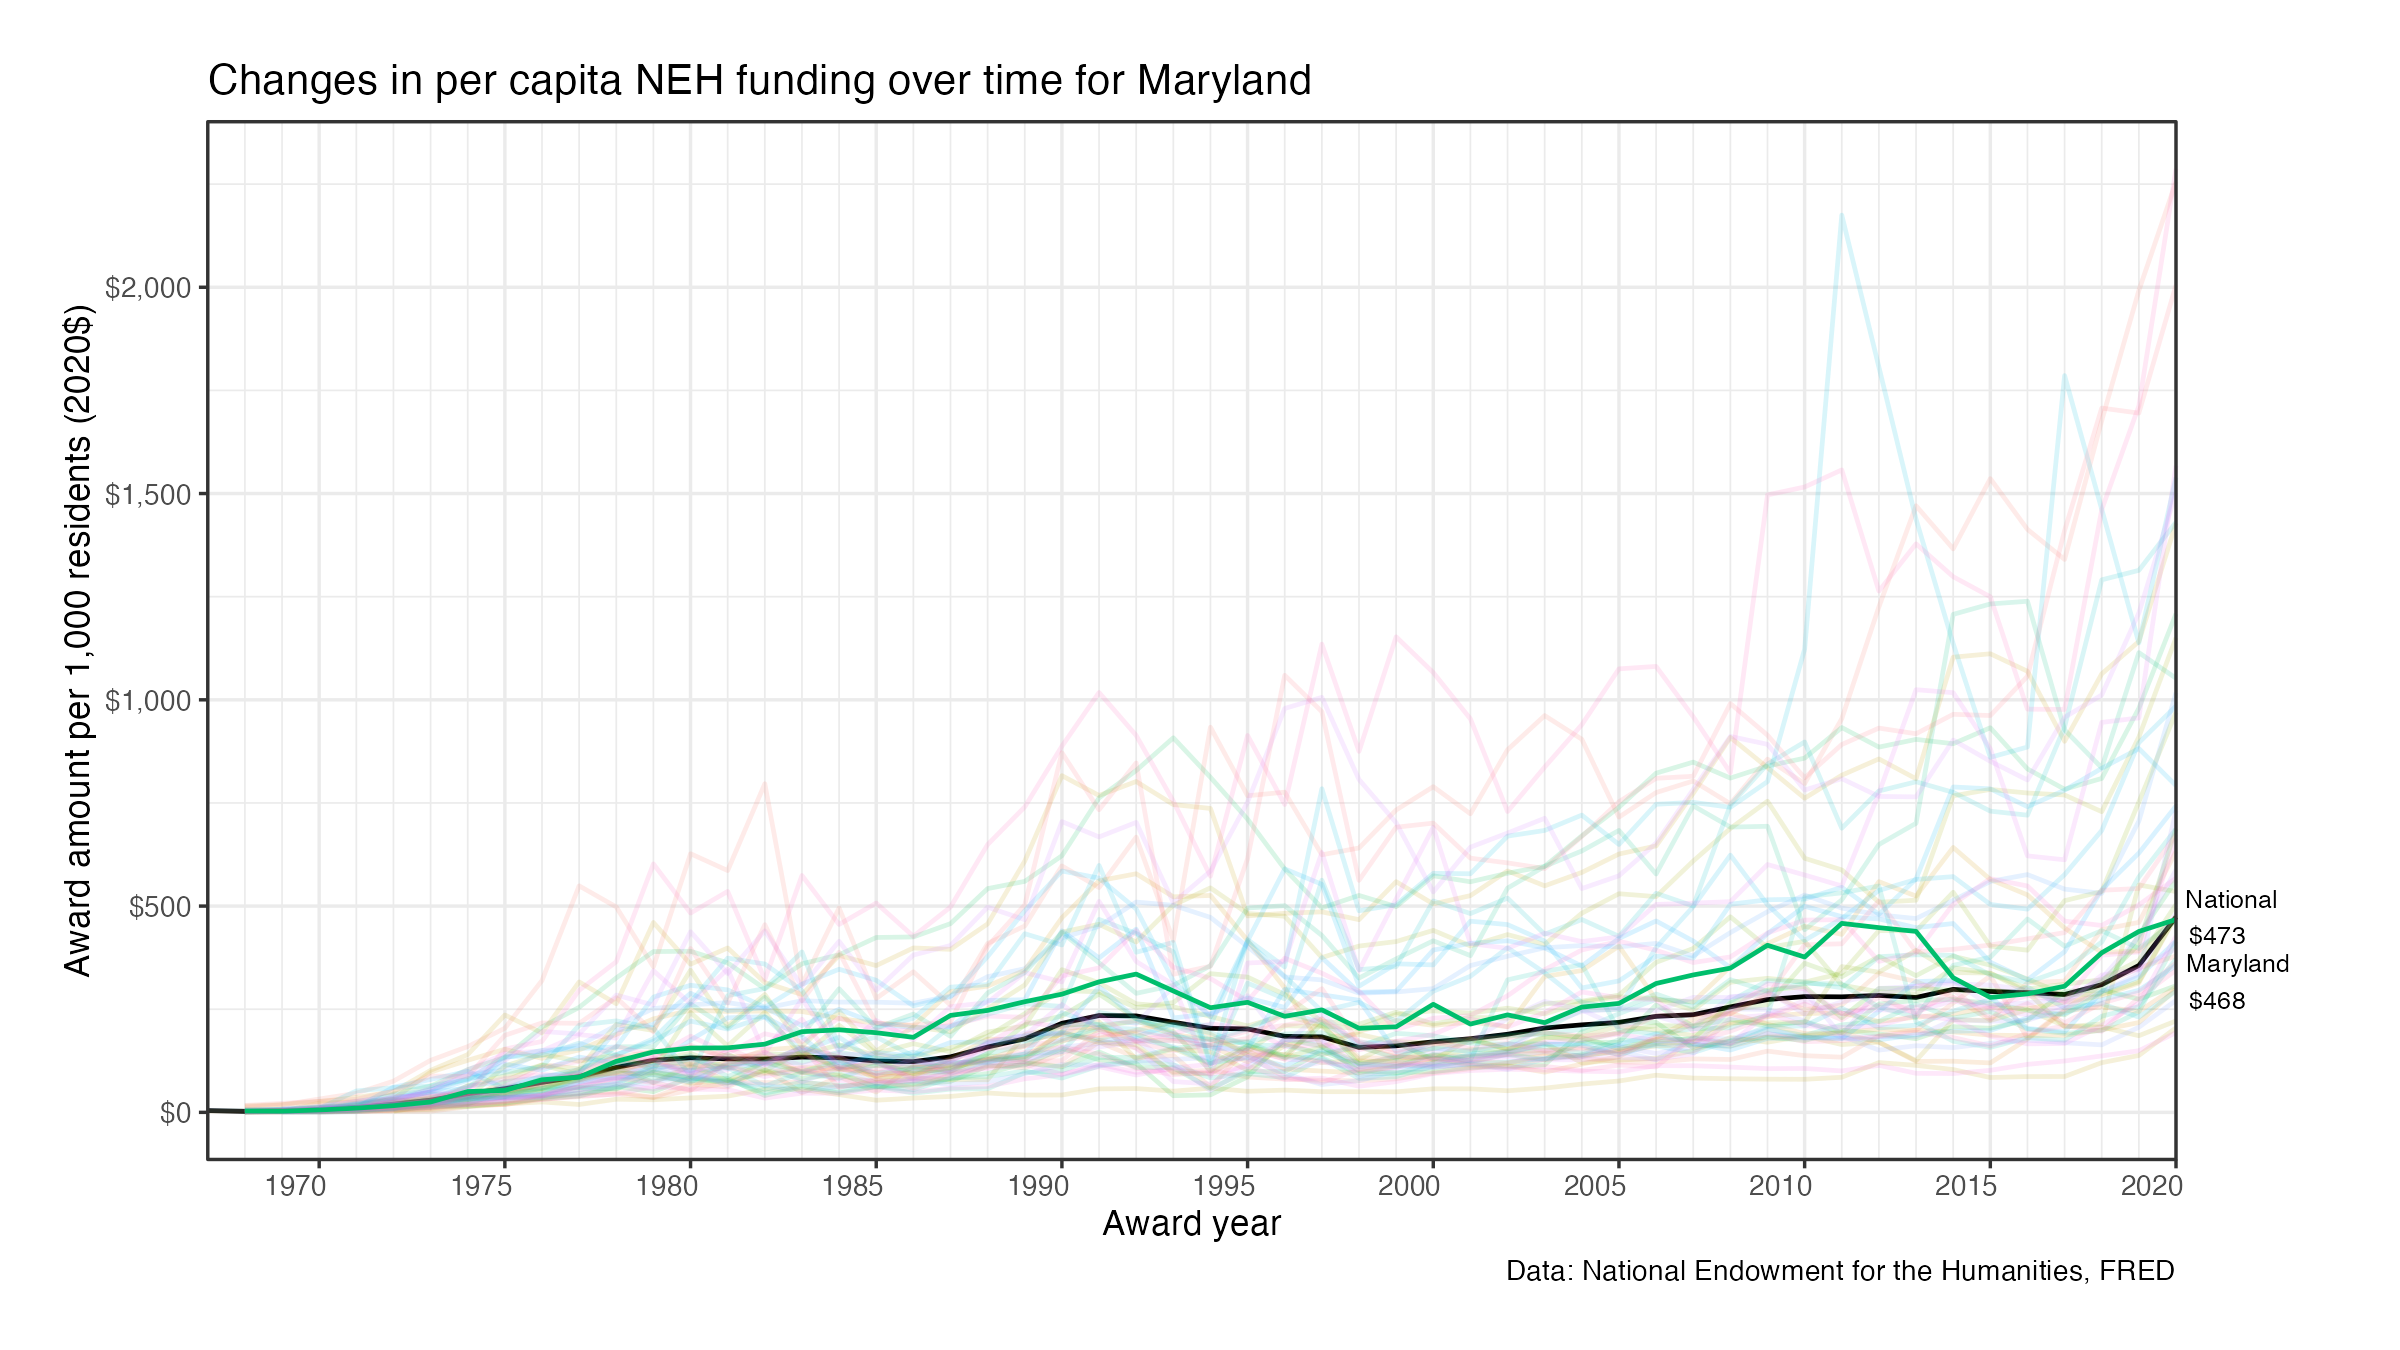
See below for links to figures of NEH funding changes over time for each state.
Conclusion
Over the course of the NEH’s existence, a large amount of money has been disbursed across the United States in support of the humanities. As this short analysis shows, people living in this country have experienced different levels financial support depending on their state of residence. Some of these differences are likely due to a complex interaction between the timing of project funding and population trends. Furthermore, the societal impact of NEH-funded projects certainly cannot be fully described by a single financial metric. That said, it remains a worthwhile goal to investigate the distribution of NEH awards to make sure that all those living in the United States have an equitable chance to take part in “the full growth of a truly great society.”
Links to all state figures
Figures for the changes in per capita NEH spending by state over time for states are linked below.
Technical details
Primary data for these analyses come from the National Endowment for the Humanities. Inflation adjustments and interstitial state-level population estimates come from the Federal Reserve Economic Data (FRED) database. Analyses were limited to grants awarded to persons or organizations located in one of the fifty states (also excluding Washington DC). Dollar amounts for all figures have been inflation adjusted to real 2020 dollars. To smooth out differences in award years, 3-year rolling averages were computed and used. All analyses were completed using the R programming language. Replication files can be found on GitHub.